Apache Spark - Performance Metrics 11,55711,557
9/8/2018
10/4/2018
4
>=5.1.4
Prometheus
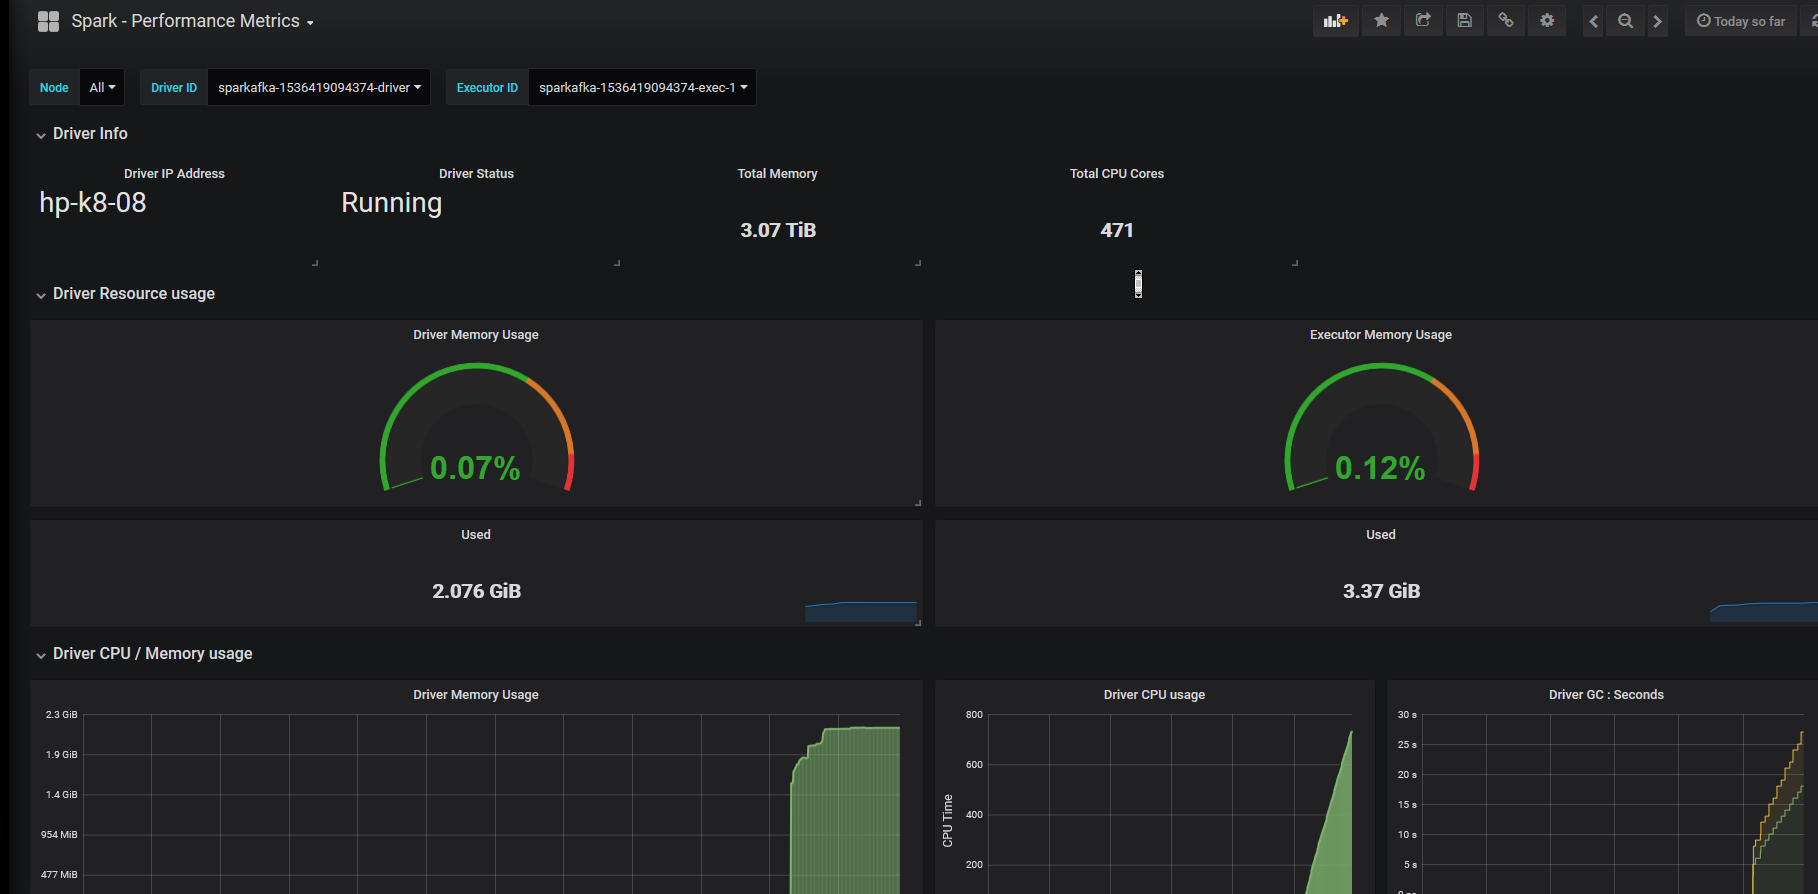
Spark Metrics Dashboard :- Having Spark Driver / Executor Memory Consumption and other related metrics in Kubernetes using JMX Exporter and Prometheus Service Discovery Including Network I/O and Disk Read/Write Metrics for Spark Driver , Executors and Shuffle Service
Add Labels to Spark Driver and Executor accordingly for Prometheus to fetch metrics through service discovery
Export Dashboard✕
Download
Copy to Clipboard