Analysis by Pod 25,62025,620 3.5 (2 reviews)
7/7/2018
7/7/2018
1
Host Metrics
>=5.2.1
Prometheus
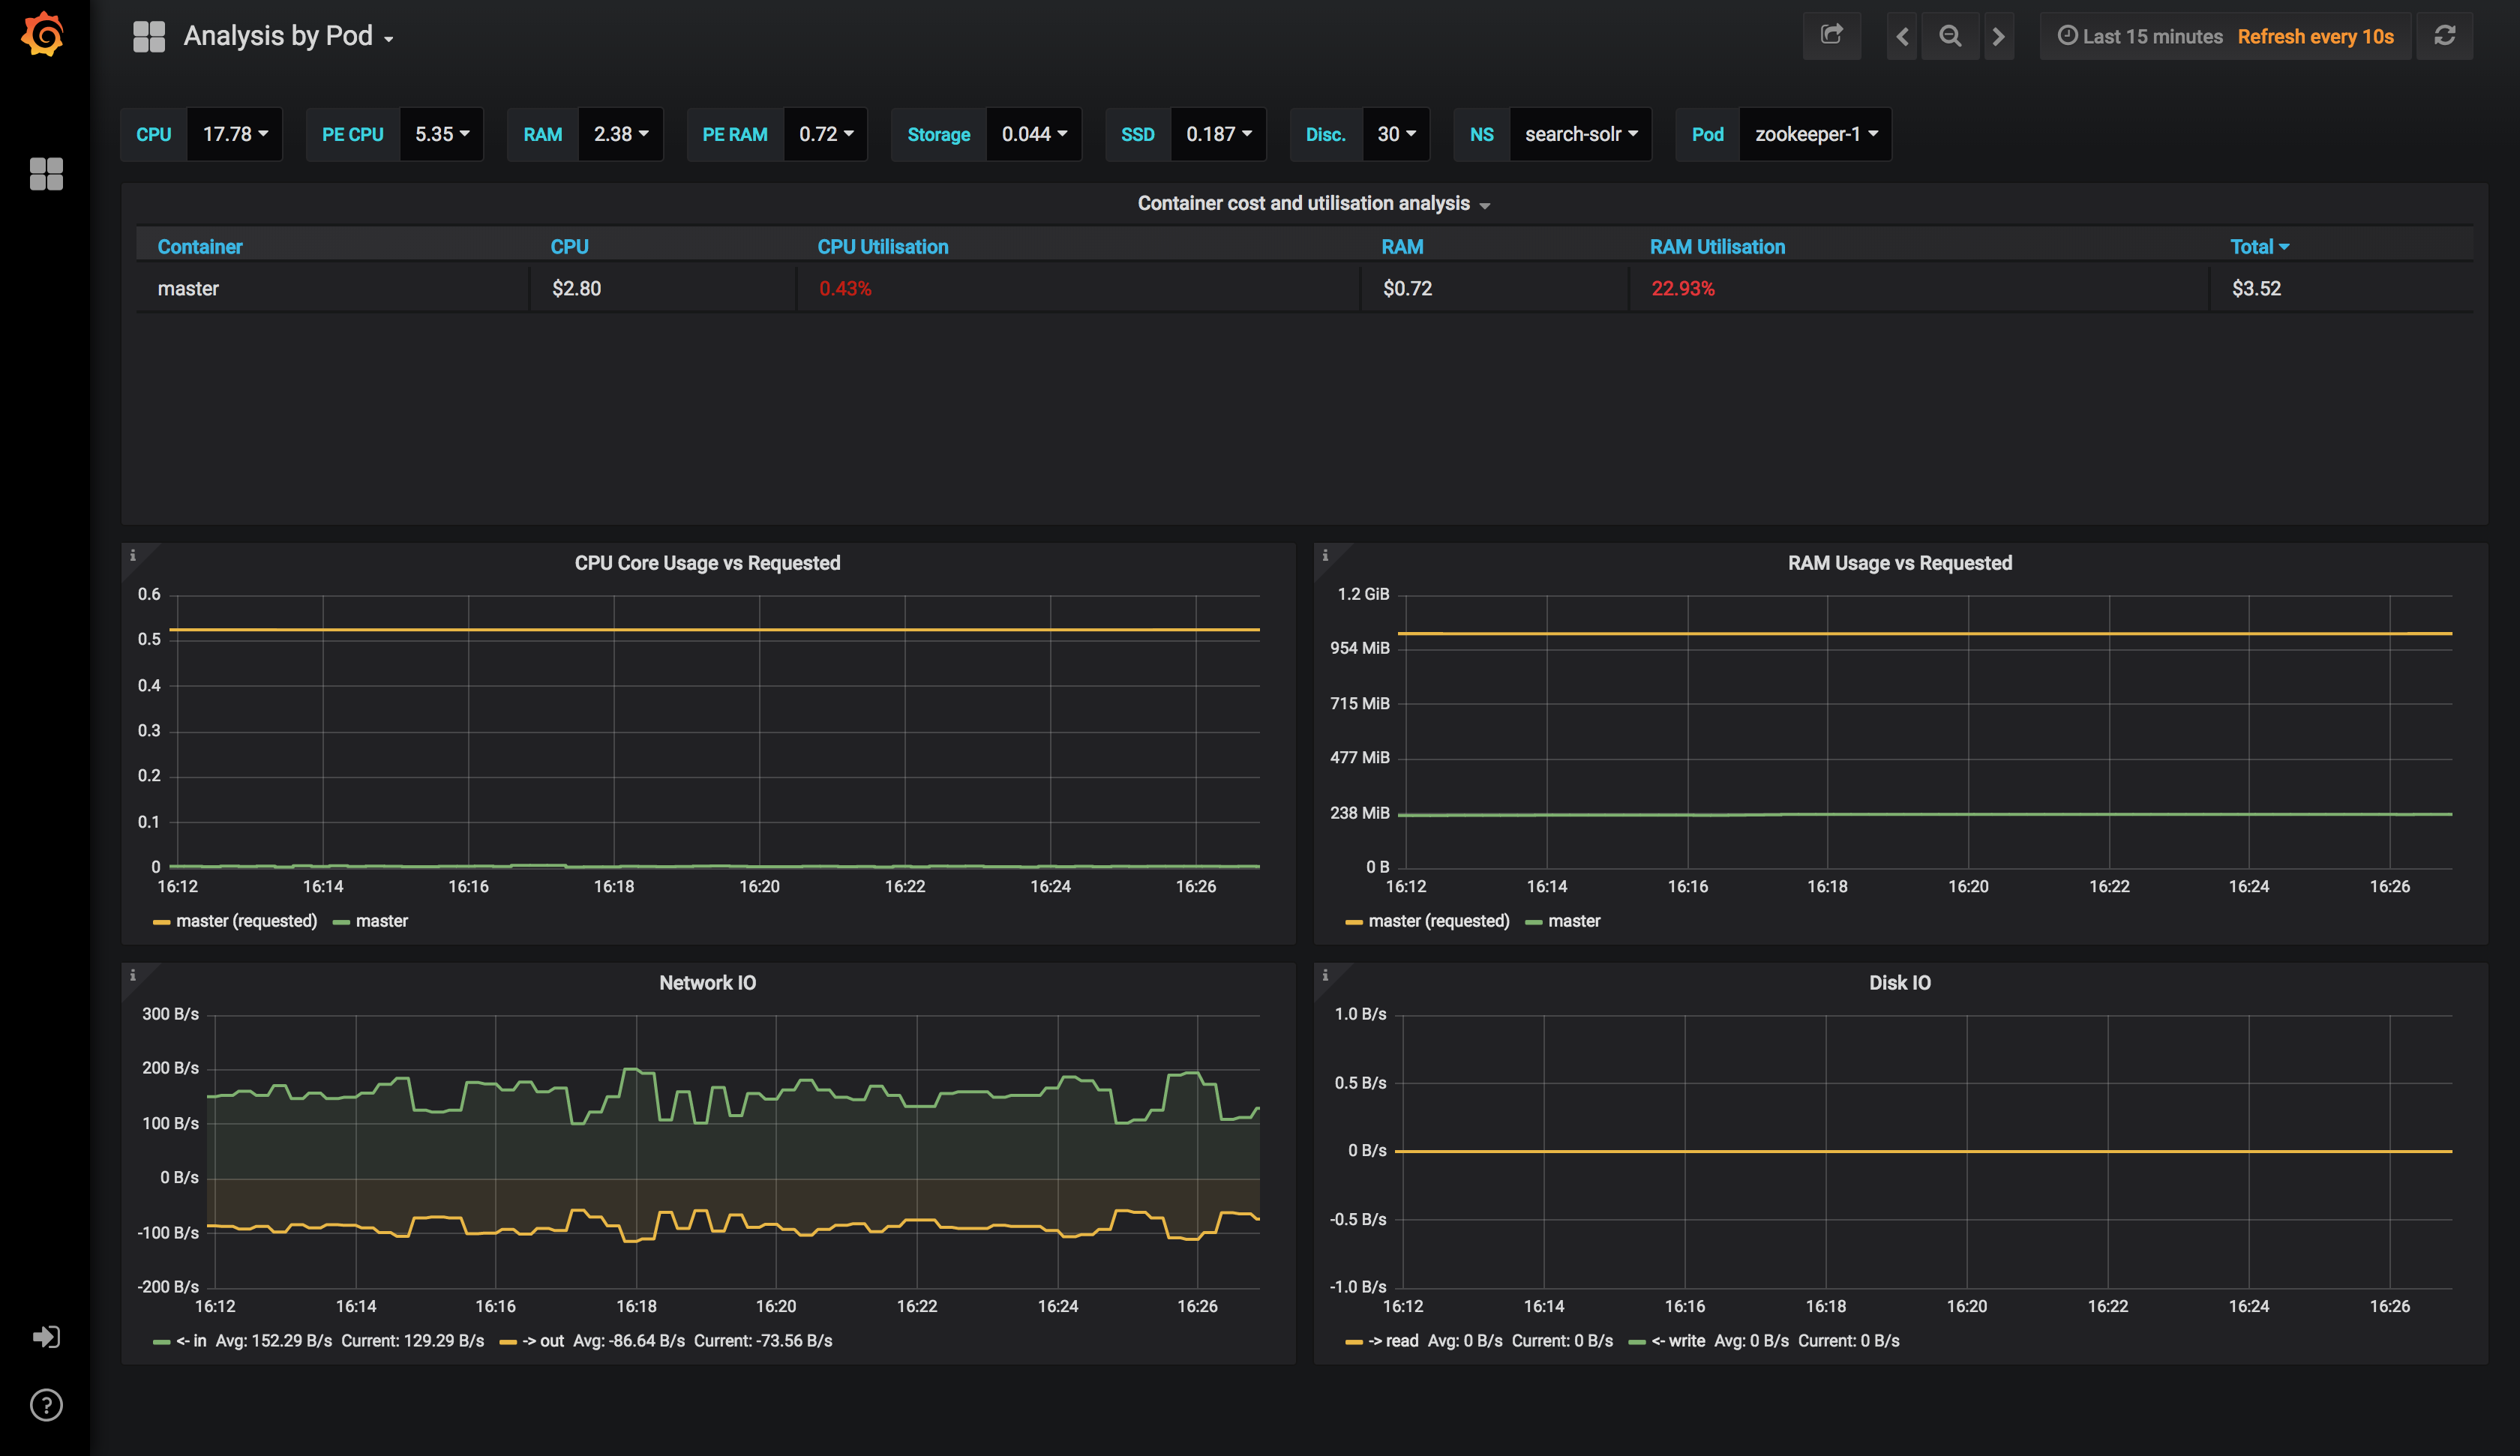
This is part 3 of 3 dashboards to help you visualise cost on kubernetes.
Please see my blog post: https://karlstoney.com/2018/07/07/managing-your-costs-on-kubernetes for more information
Export Dashboard✕
Download
Copy to Clipboard
Used Metrics 1313
-
container_spec_cpu_shares
costcpu
costDiscount
costpcpu
-
container_cpu_usage_seconds_total
container_spec_memory_limit_bytes
costram
costpram
-
container_memory_working_set_bytes
-
container_network_receive_bytes_total
-
container_network_transmit_bytes_total
-
container_fs_writes_bytes_total
-
container_fs_reads_bytes_total