Kubernetes Nodes 7,7657,765 5.0 (3 reviews)
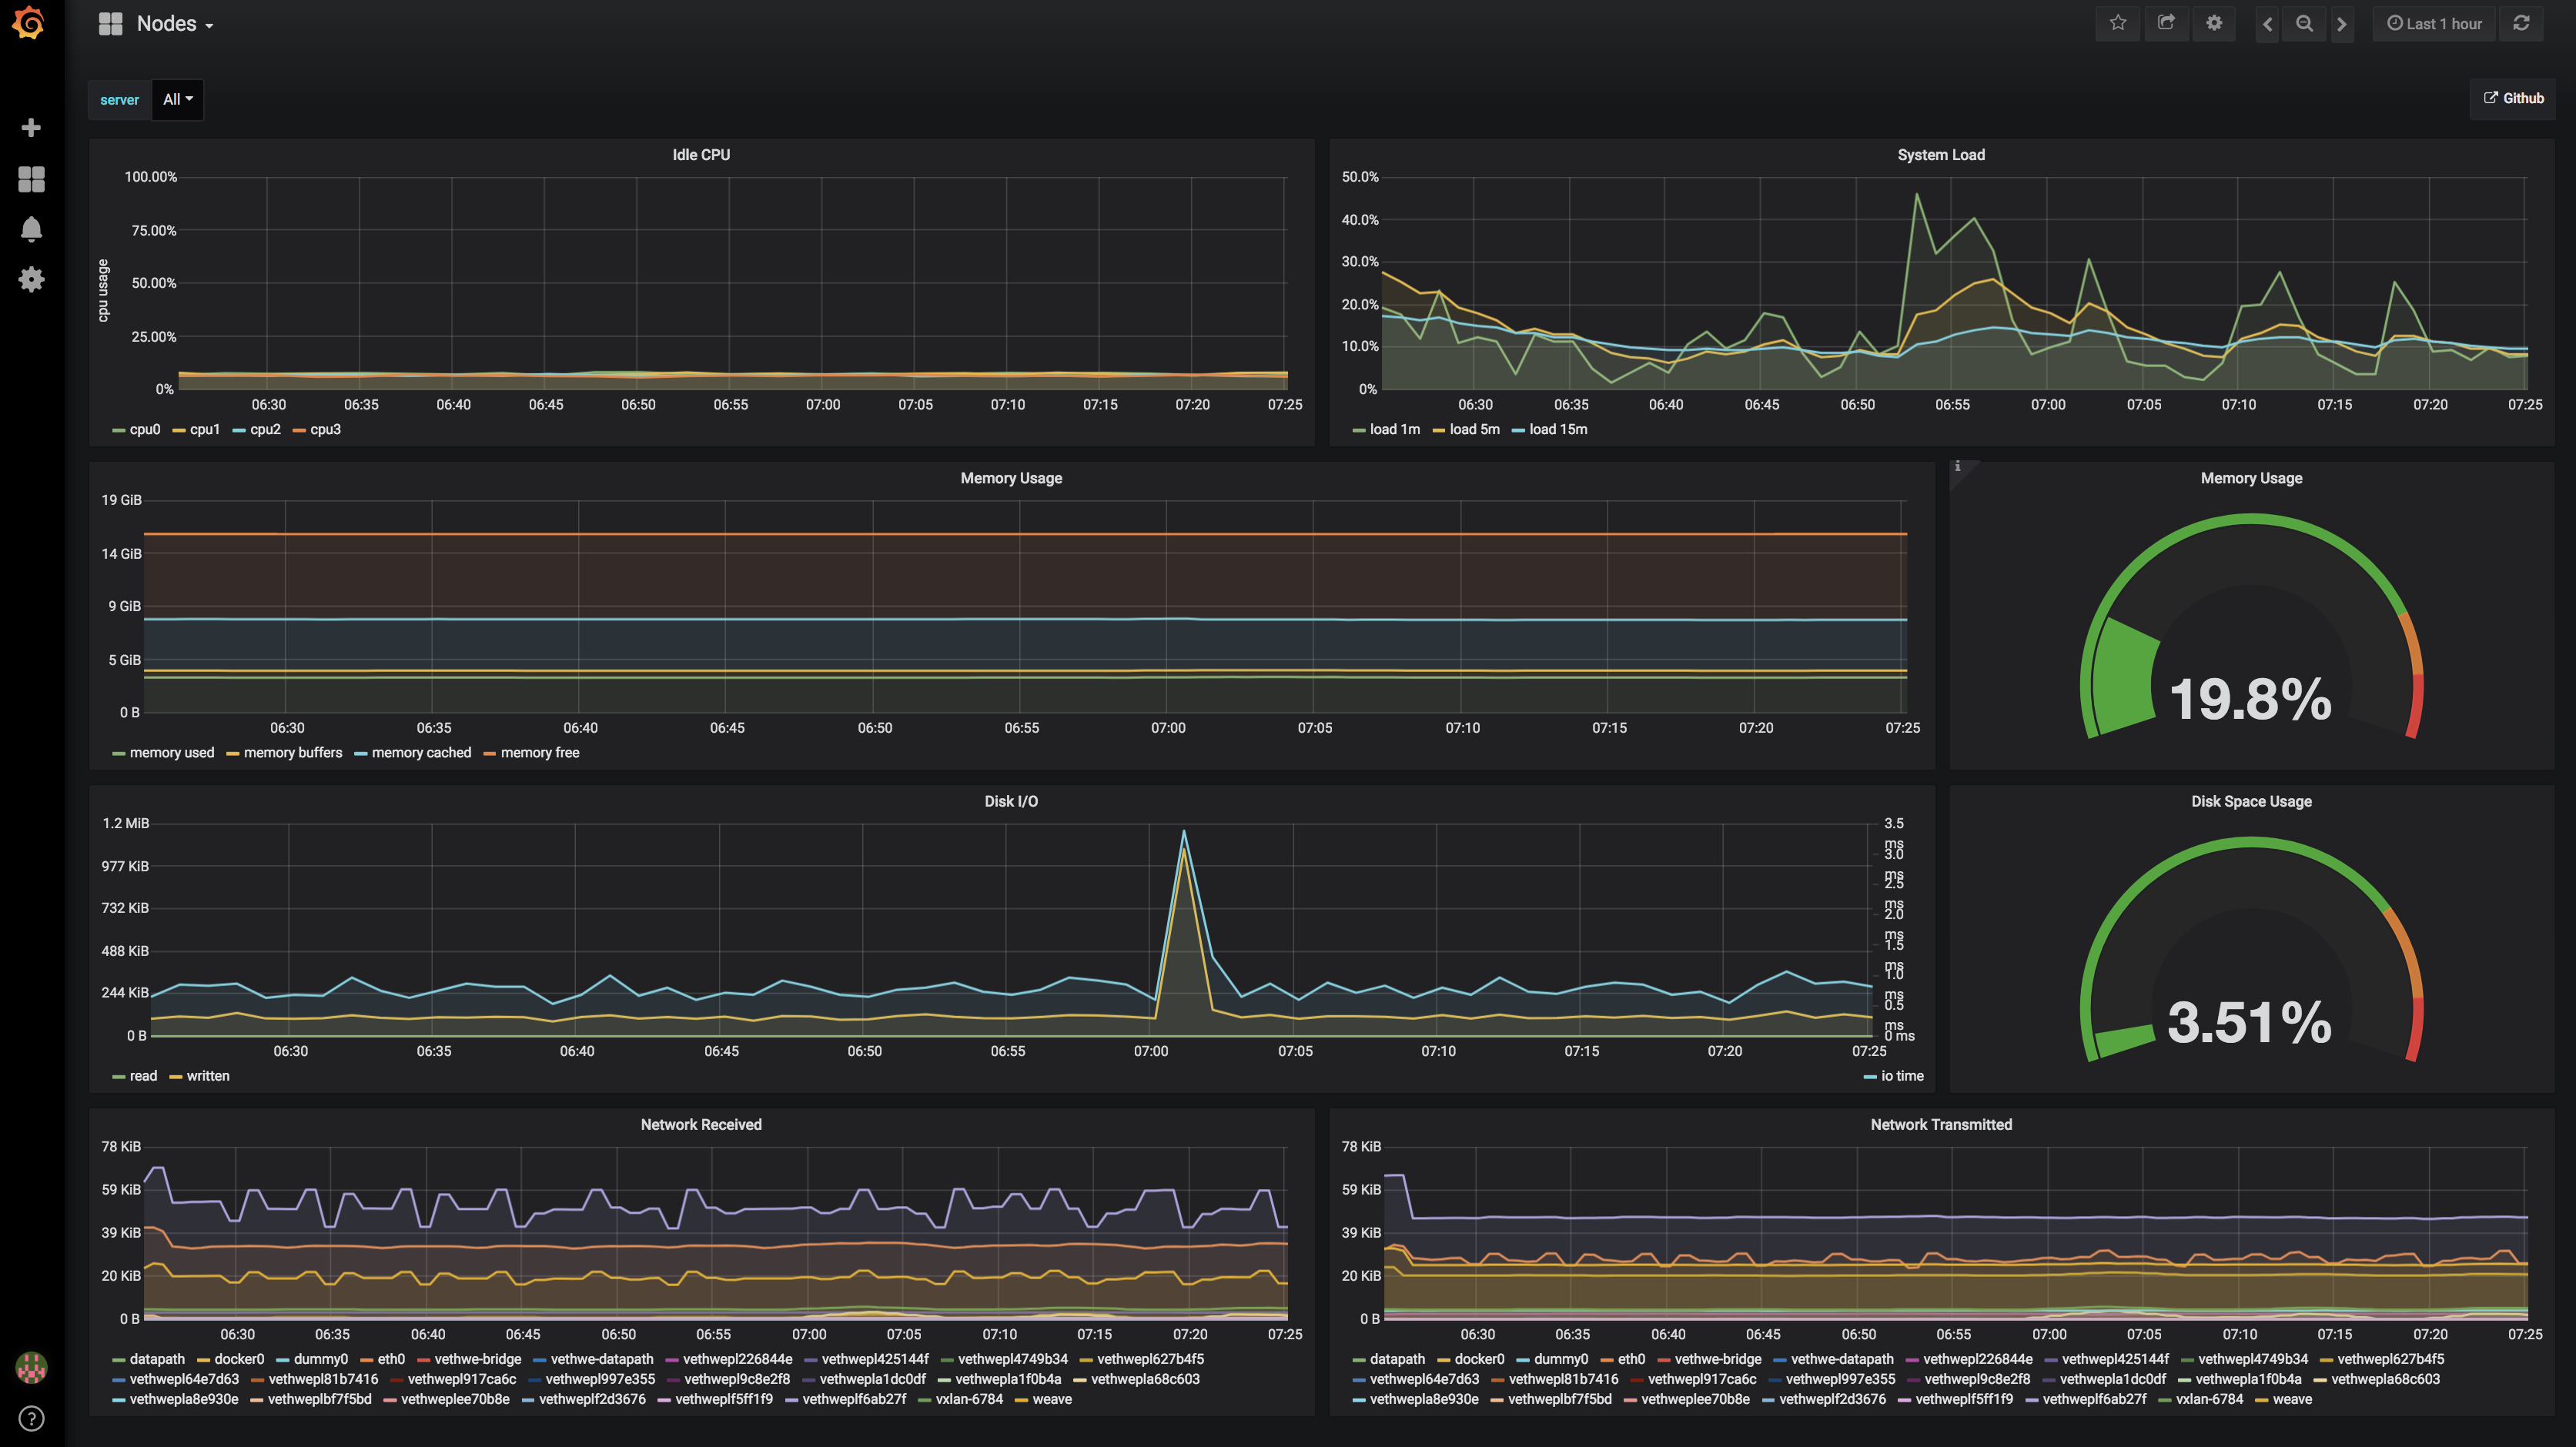
Displays cpu/memory/networking/disk for individual nodes or all nodes averaged together.
The configuration is compatible with this instillation of Prometheus - https://github.com/kubernetes/charts/tree/master/stable/prometheus A default node exporter will also likely function.
Dashboard sources - https://github.com/sstarcher/grafana-dashboards
Used Metrics 1717
-
node_cpu_seconds_total
-
node_load1
-
node_load5
-
node_load15
-
node_memory_MemTotal_bytes
-
node_memory_MemFree_bytes
-
node_memory_Buffers_bytes
-
node_memory_Cached_bytes
-
node_disk_read_bytes_total
-
node_disk_written_bytes_total
-
node_disk_io_time_seconds_total
-
node_filesystem_size_bytes
-
node_filesystem_free_bytes
-
node_network_receive_bytes_total
-
node_network_transmit_bytes_total
-
container_cpu_usage_seconds_total
-
container_memory_usage_bytes