3Scale 939939 3.0 (1 reviews)
4/1/2020
2/2/2021
5
Docker
>=7.3.7
Prometheus
Description
Added 3scale 2.9 features
Screenshots
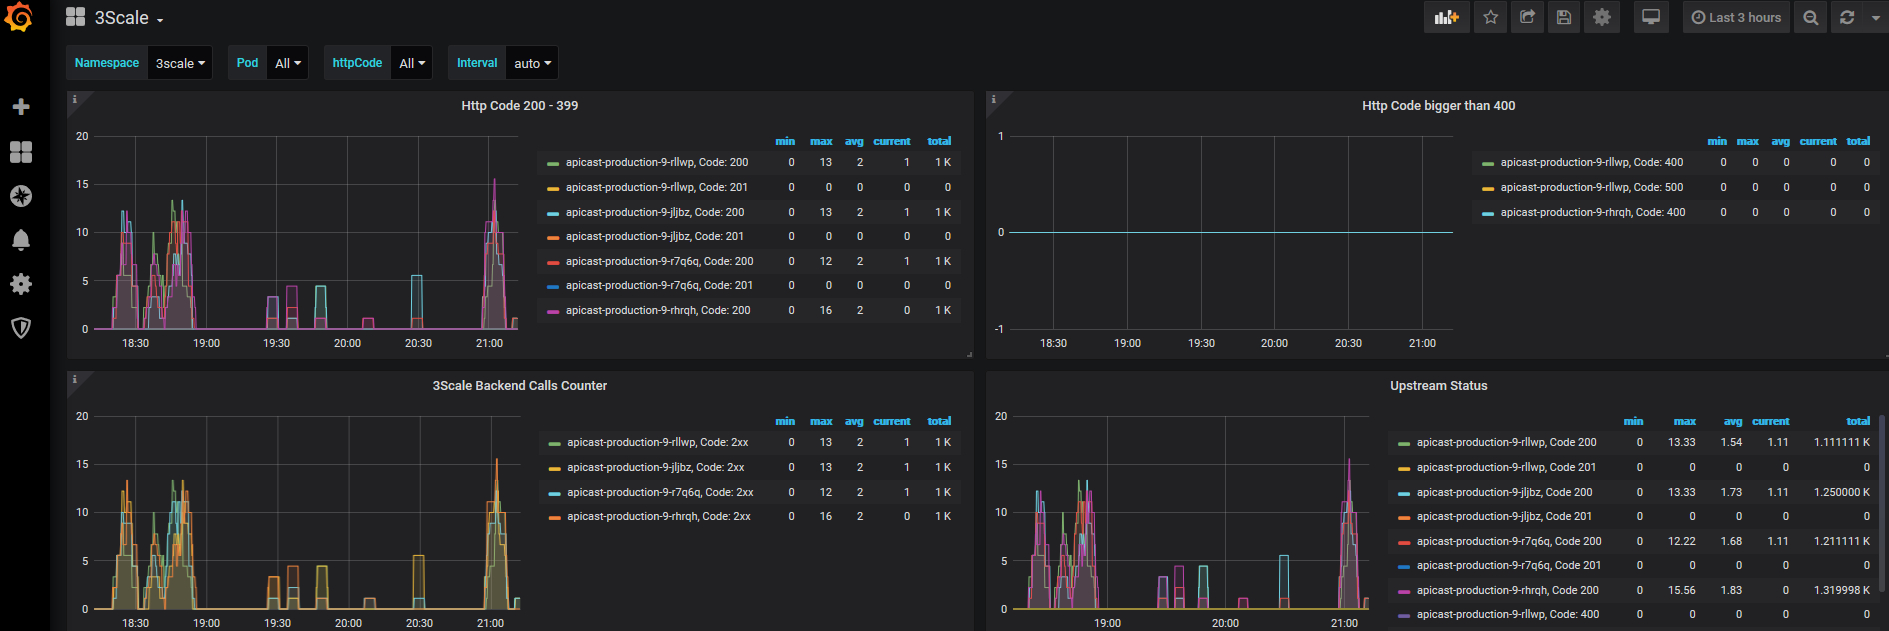
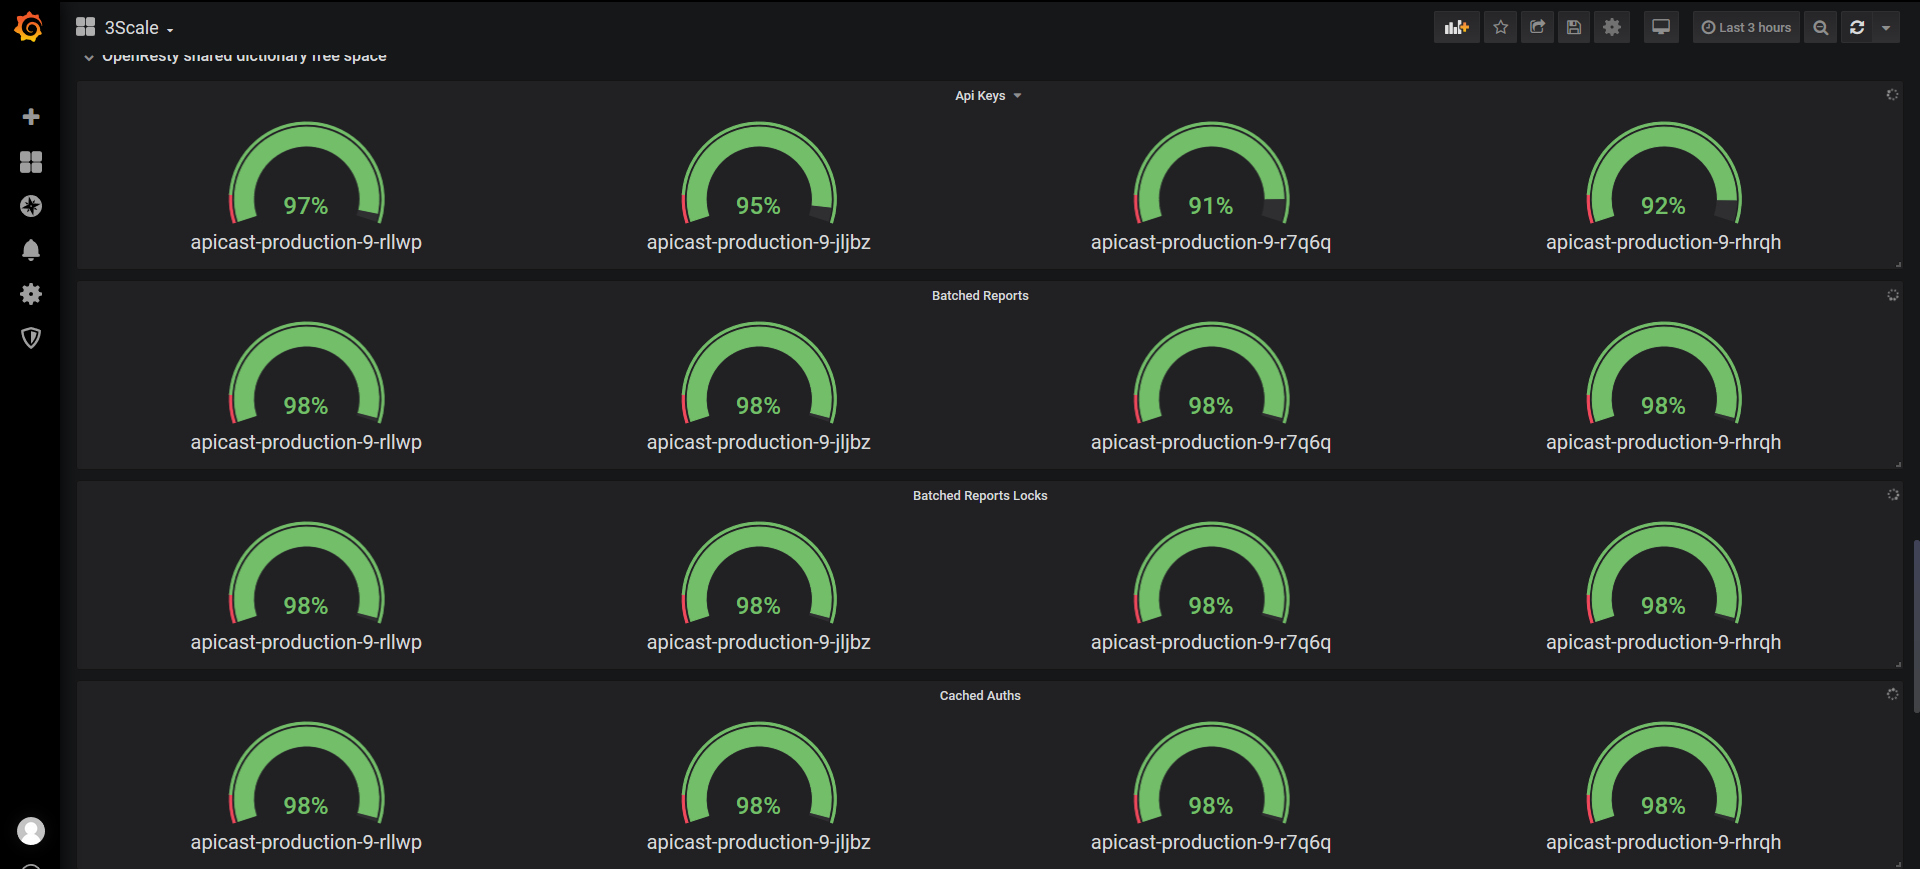
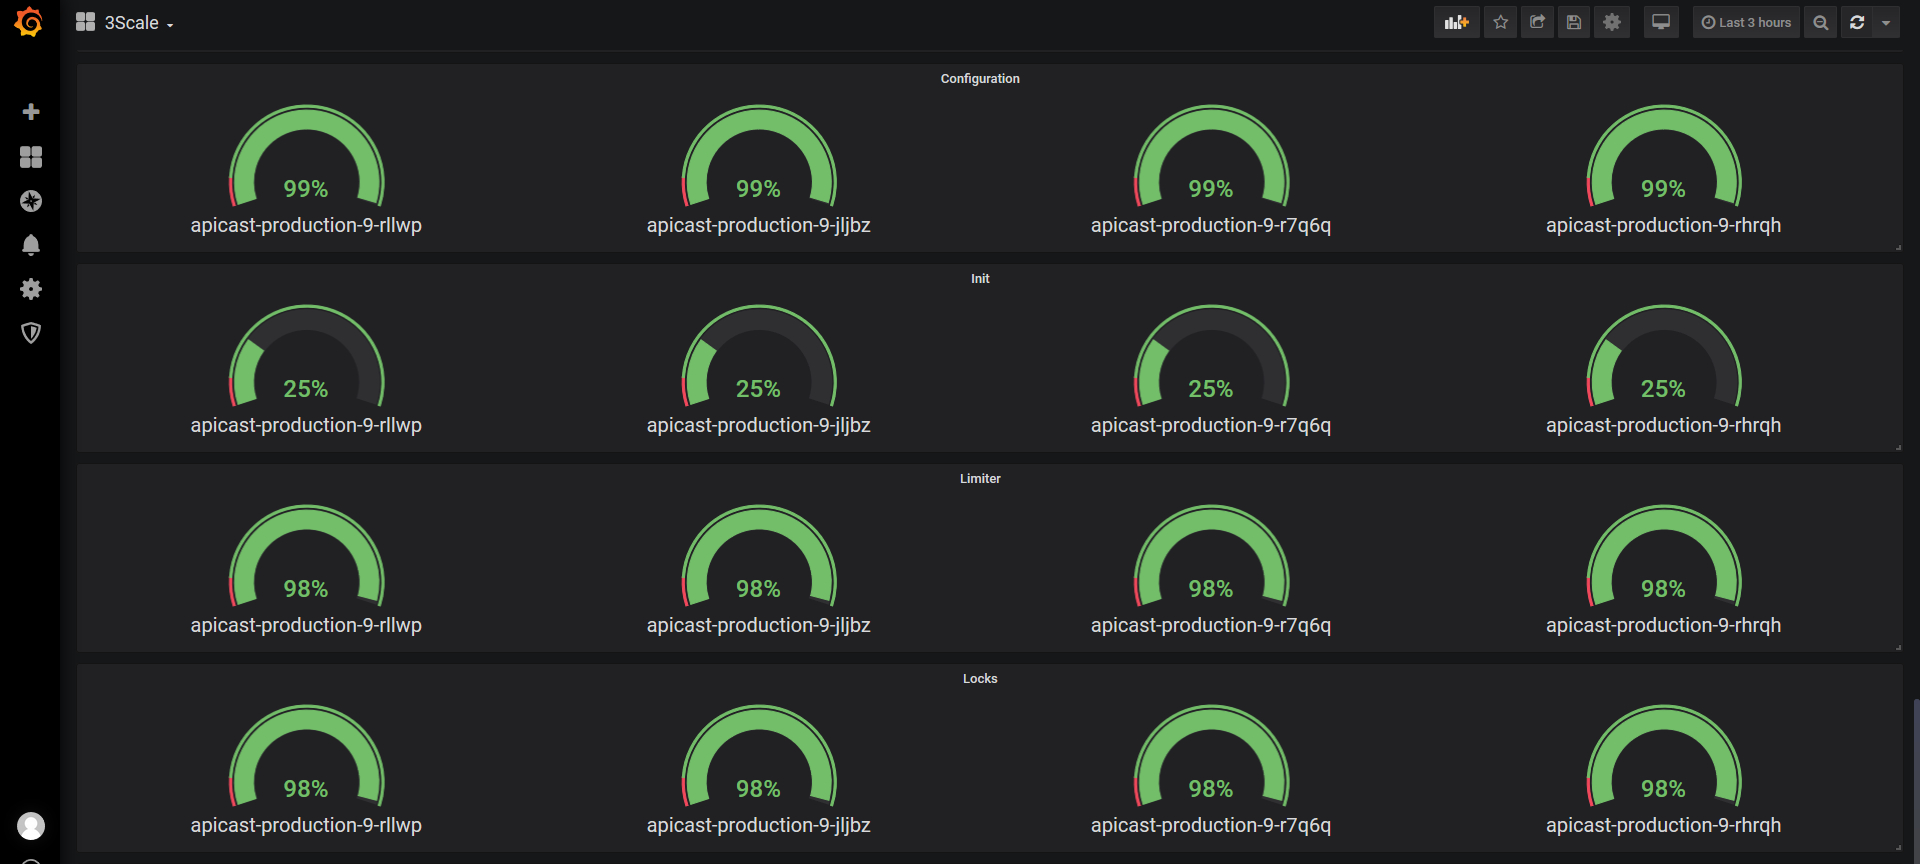
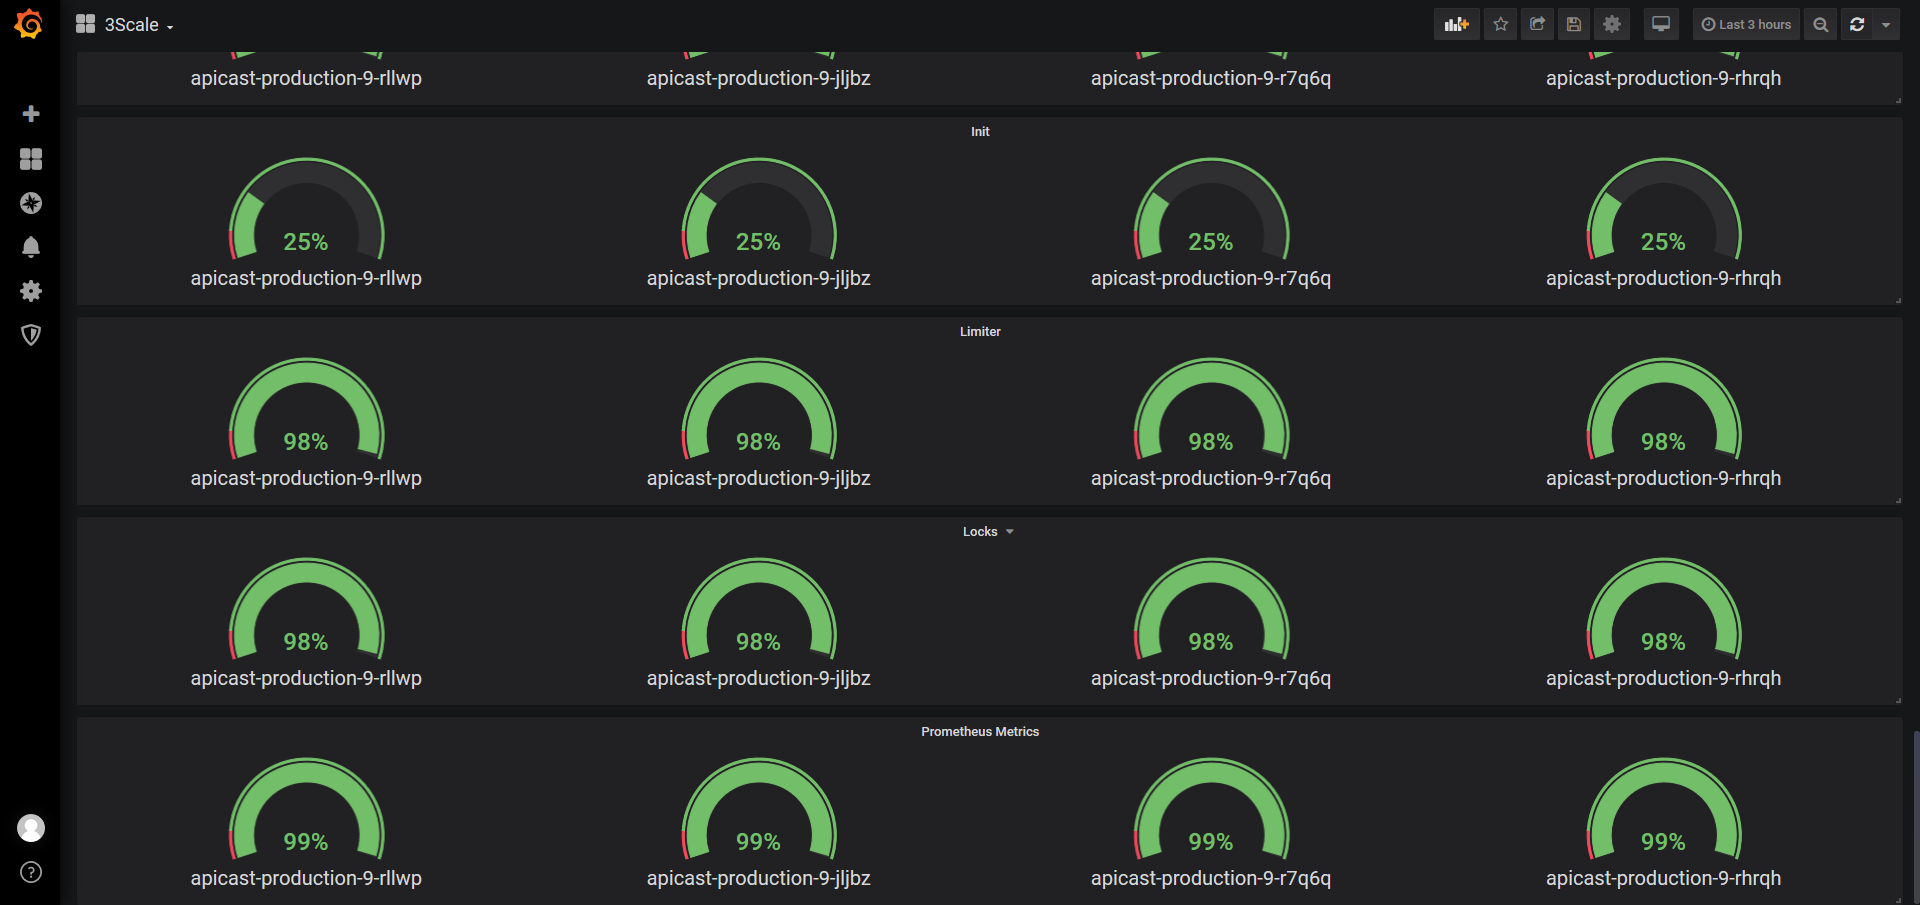
Used Metrics 33
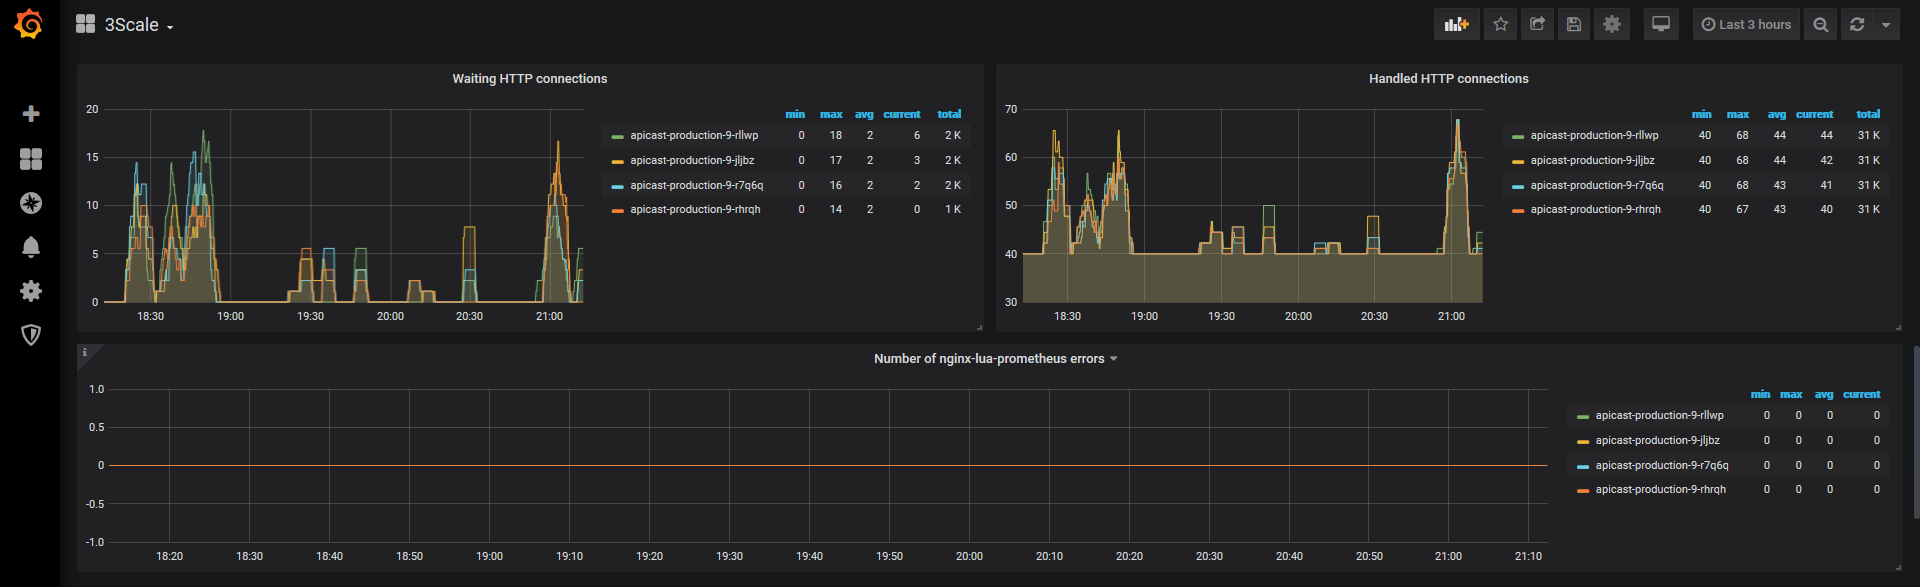
nginx_error_log
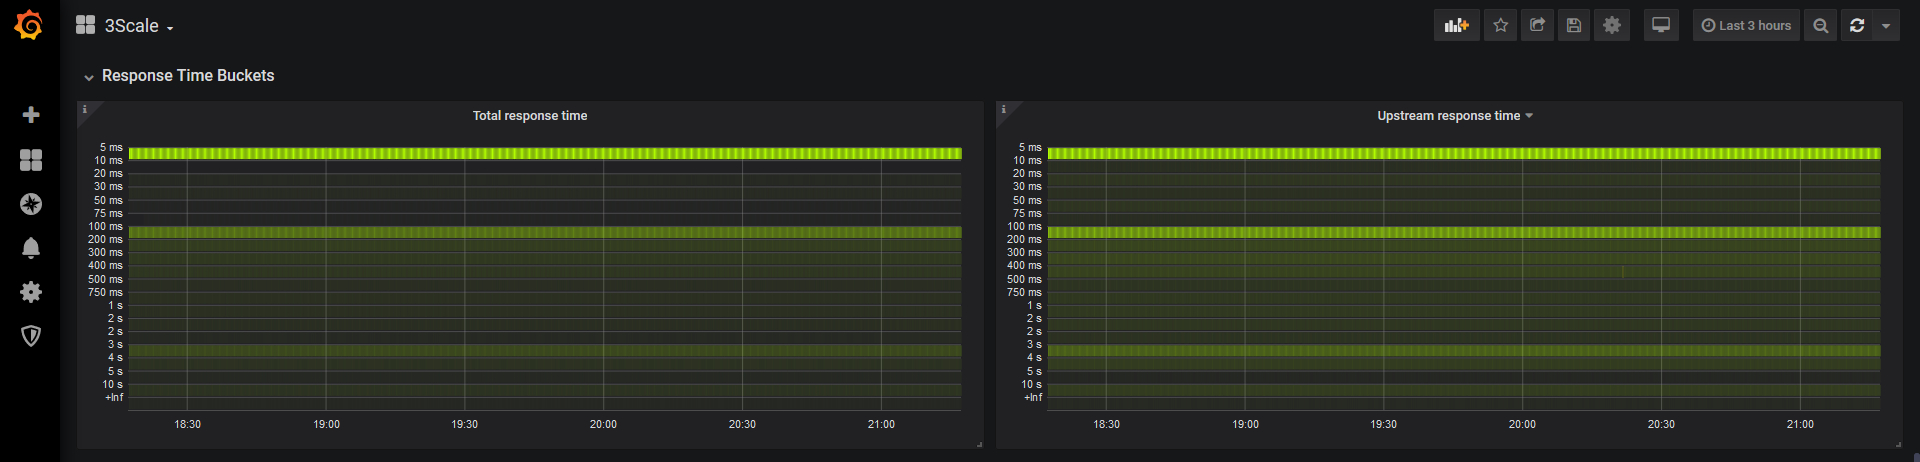
time_range
upstream_status
Get Dashboard✕
Download
Copy to Clipboard