Kubernetes Cluster Autoscaler (via Prometheus) 13,530,14013,530,140 3.0 (1 reviews)
11/23/2017
11/23/2017
1
>=4.4.1
Prometheus
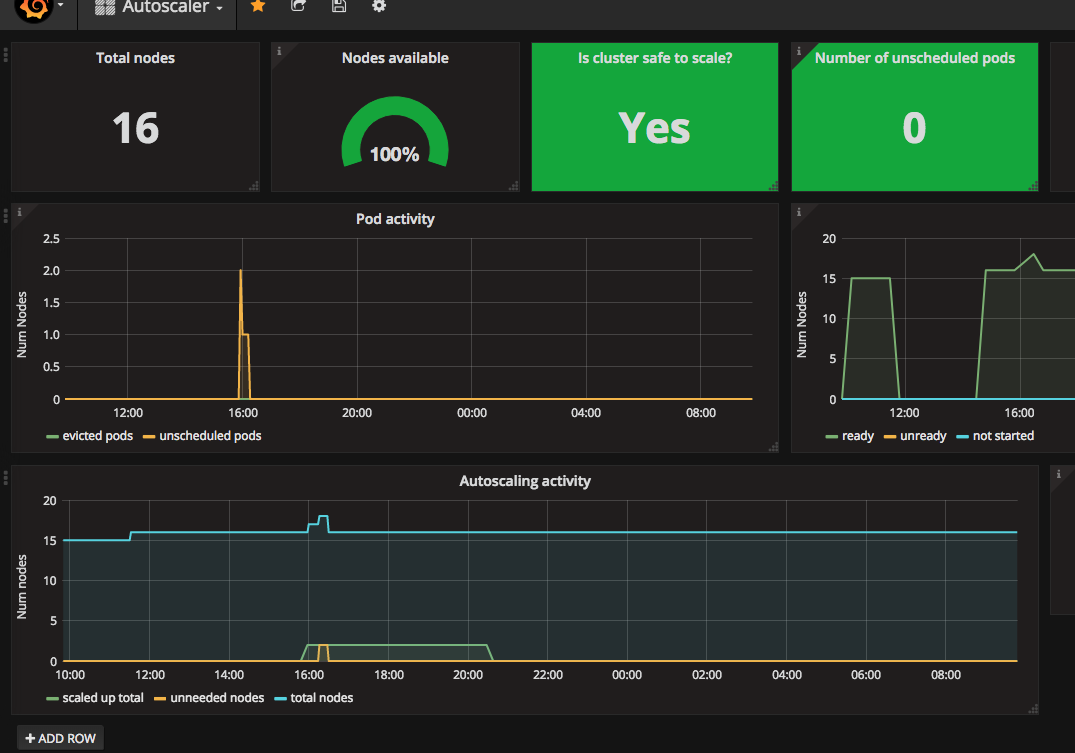
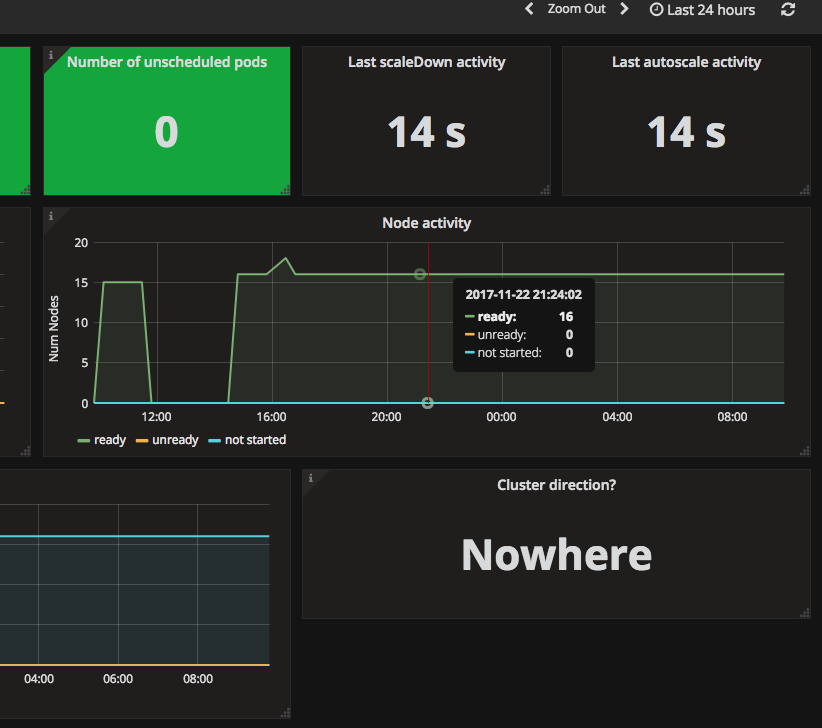
Super simple dashboard showing an overview of kubernetes cluster autoscaling activity and status.
Currently only tested with v0.6 of the cluster-autoscaler - we'll be upgrading to v1.0 shortly.
The dashboard is driven using the data reported by the cluster-autoscaler /metrics endpoint. You'll have to make sure this is exposed on the deployment and create a service + serviceMonitor for your autoscaler in order to have prometheus scrape the endpoint.
I made this because I couldn't find one - if you find/make a better one please ping me
Export Dashboard✕
Download
Copy to Clipboard