Mattermost Performance Monitoring (Bonus Metrics) 4,5294,529
Mattermost Performance Monitoring (Bonus Metrics)
Performance monitoring support enables a Mattermost server to track system health for large Enterprise deployments through integrations with Prometheus and Grafana.
The integration supports data collection from several Mattermost servers, particularly useful if you’re running Mattermost in high availability mode.
For more information on configuration and metrics collections, visit the Mattermost documentation.
Report issues or feedback in the Mattermost forums or join the discussion in the public Developers Performance channel.
Used Metrics 2222
mattermost_login_logins_total
mattermost_login_logins_fail_total
mattermost_post_emails_sent_total
mattermost_post_pushes_sent_total
mattermost_post_file_attachments_total
mattermost_search_posts_searches_total
mattermost_search_posts_searches_duration_seconds_sum
mattermost_search_posts_searches_duration_seconds_count
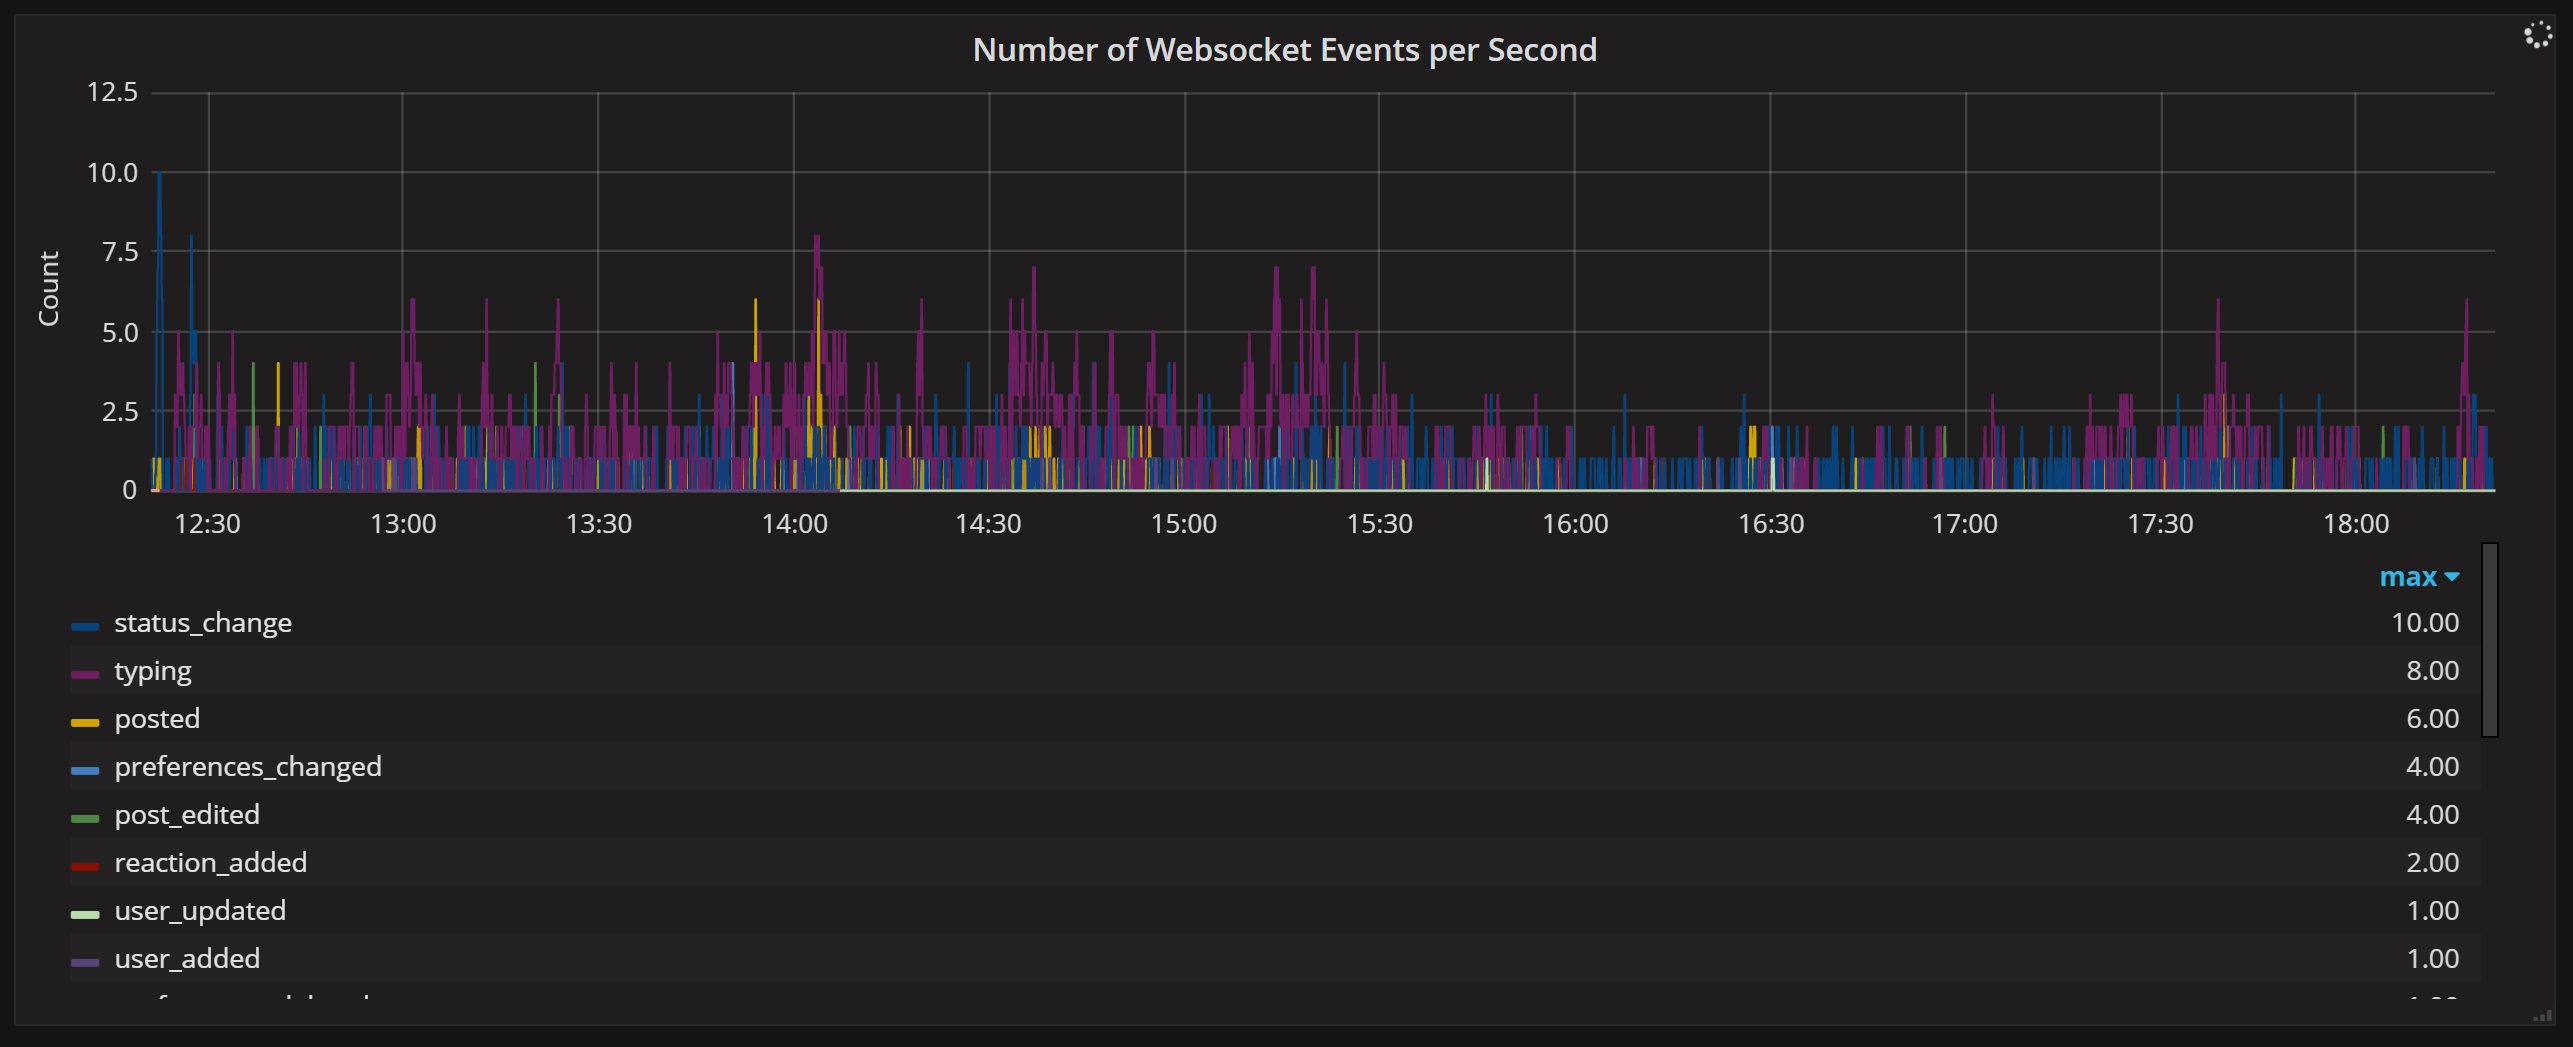
mattermost_websocket_event_total
mattermost_websocket_broadcasts_total
mattermost_http_requests_total
mattermost_cluster_cluster_requests_total
mattermost_cluster_cluster_event_type_totals
-
go_gc_duration_seconds
-
go_memstats_heap_objects
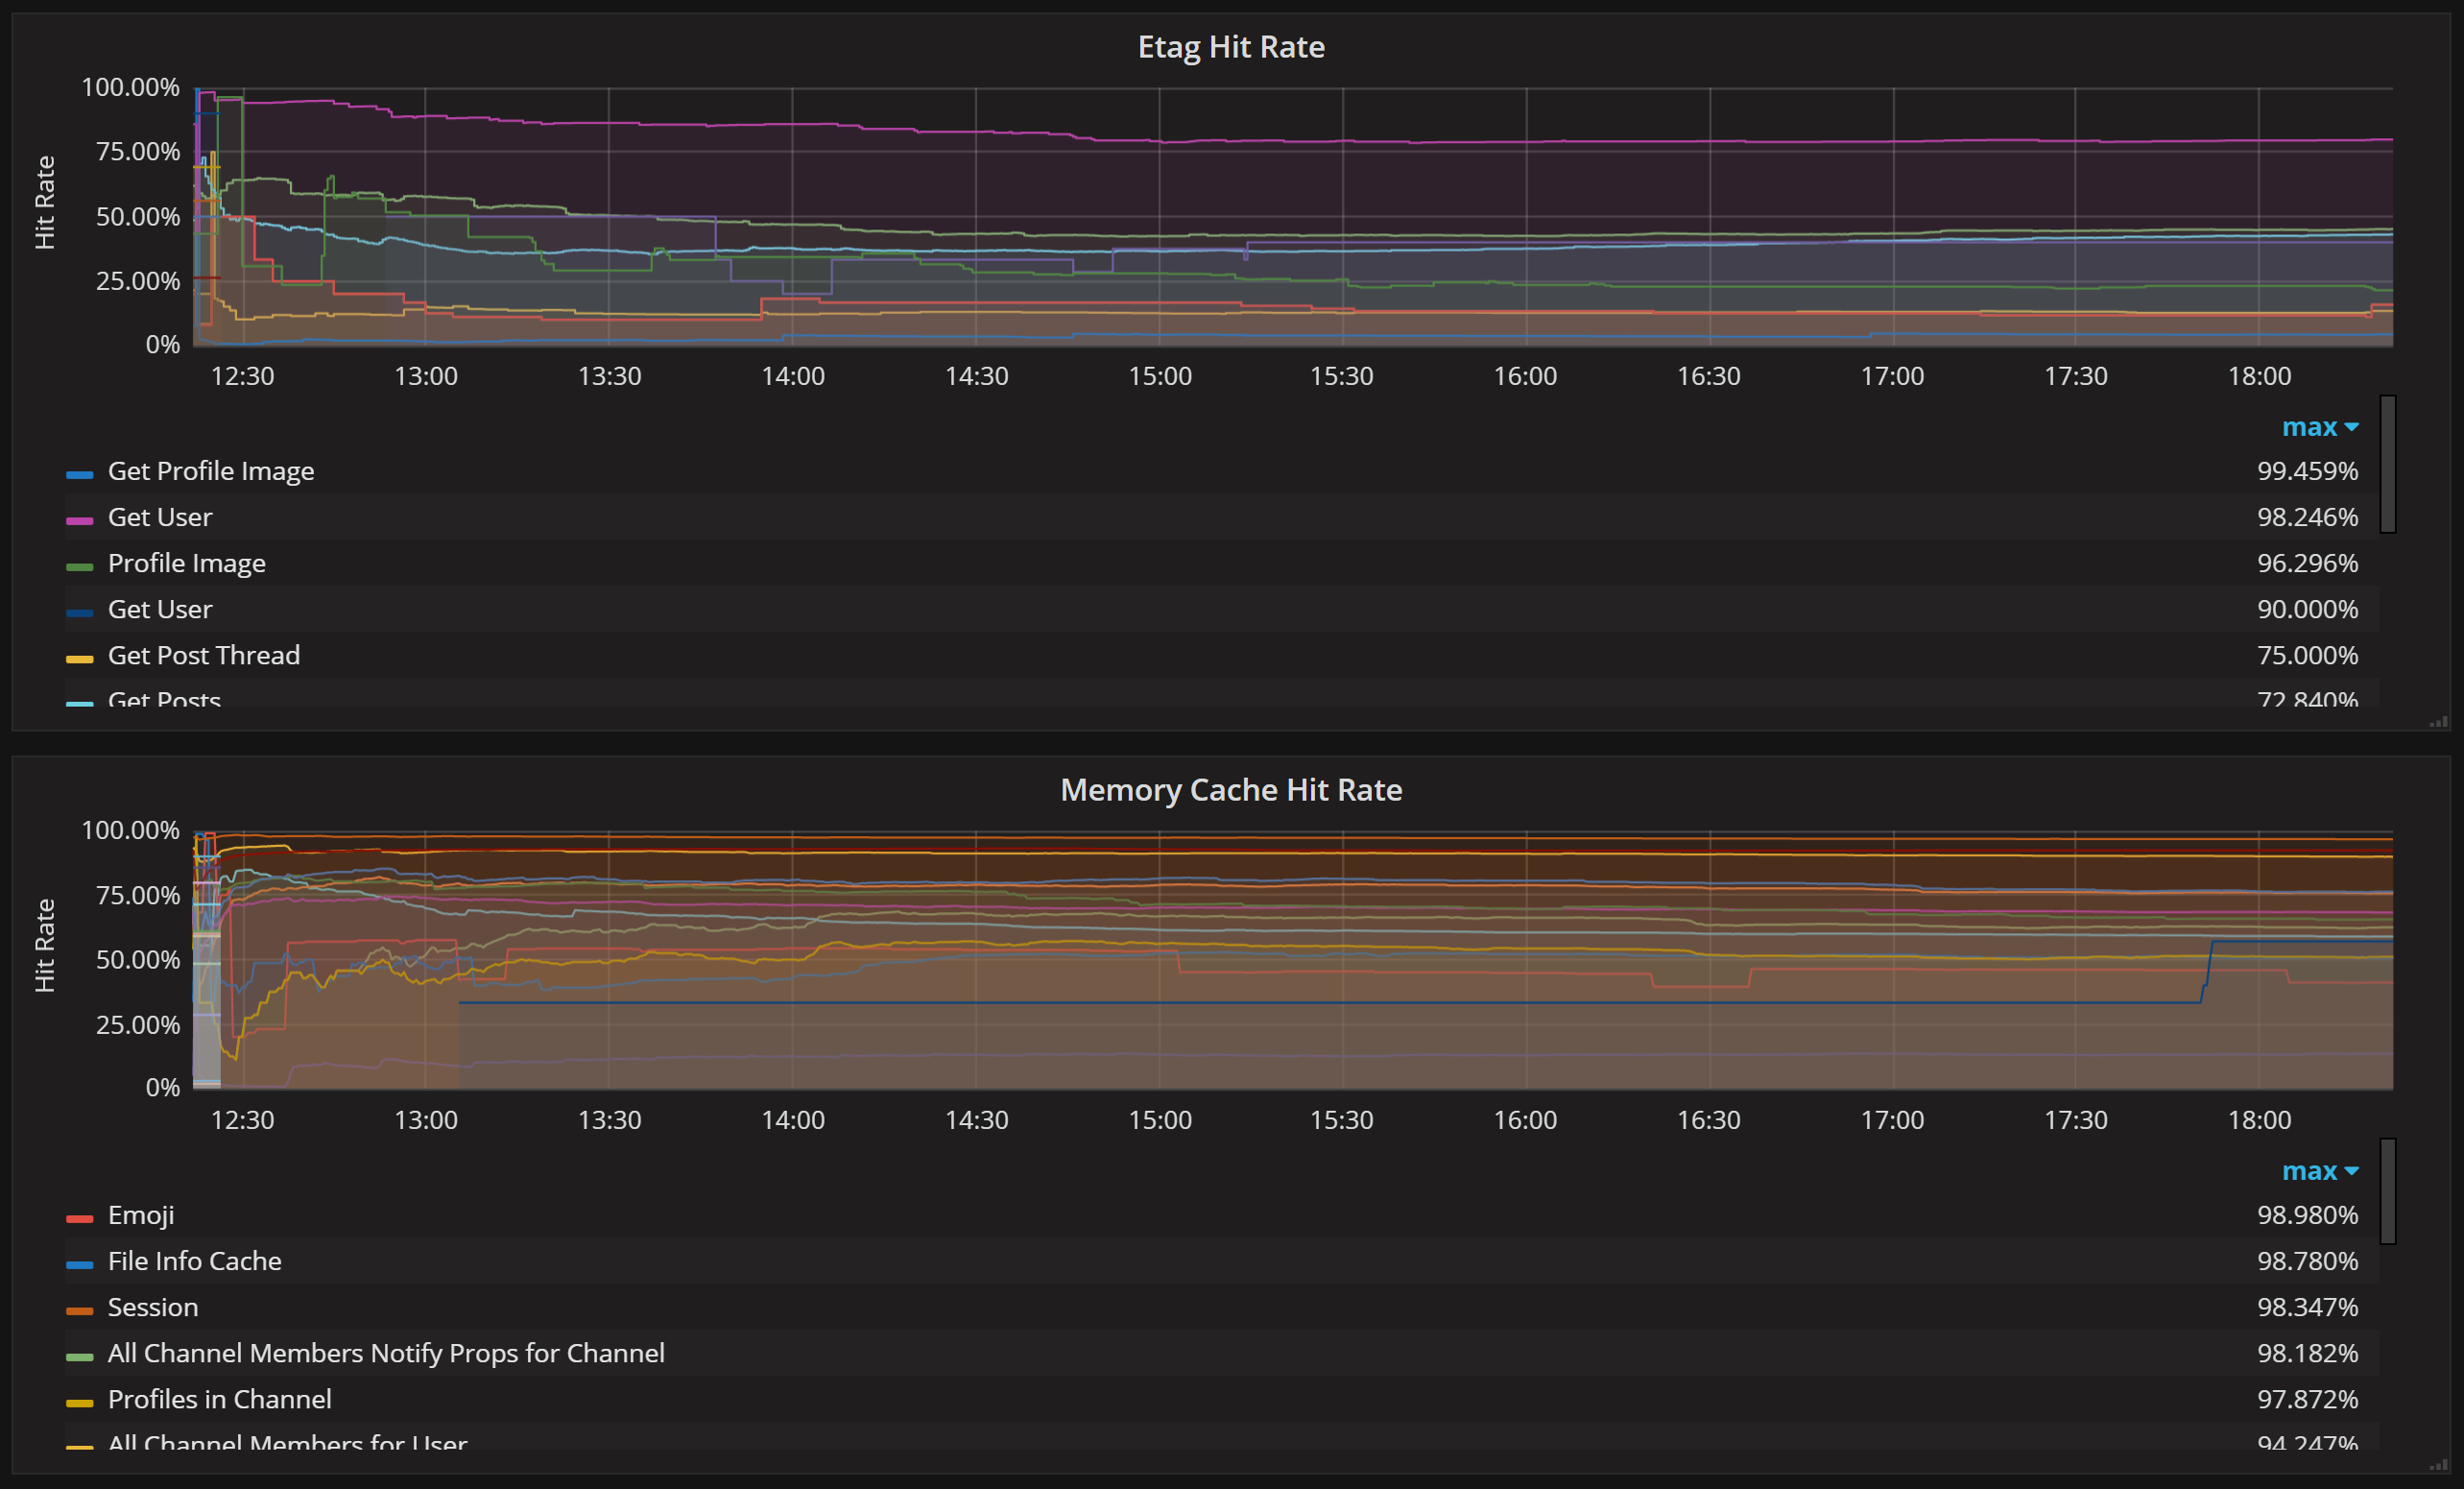
mattermost_cache_etag_hit_total
mattermost_cache_etag_miss_total
mattermost_cache_mem_hit_total
mattermost_cache_mem_miss_total
mattermost_process_resident_memory_bytes
mattermost_process_virtual_memory_bytes
mattermost_process_open_fds