K8s Node Metrics / Multi Clusters (Node Exporter, Prometheus, Grafana11, 2025, EN) 3,3783,378
Original Source (11074)
- https://grafana.com/grafana/dashboards/11074-node-exporter-for-prometheus-dashboard-en-v20201010/
- https://github.com/starsliao/Prometheus
Custom Changes (22413)
- Latest: https://github.com/YunanJeong/cmm
- Support Grafana 11.3
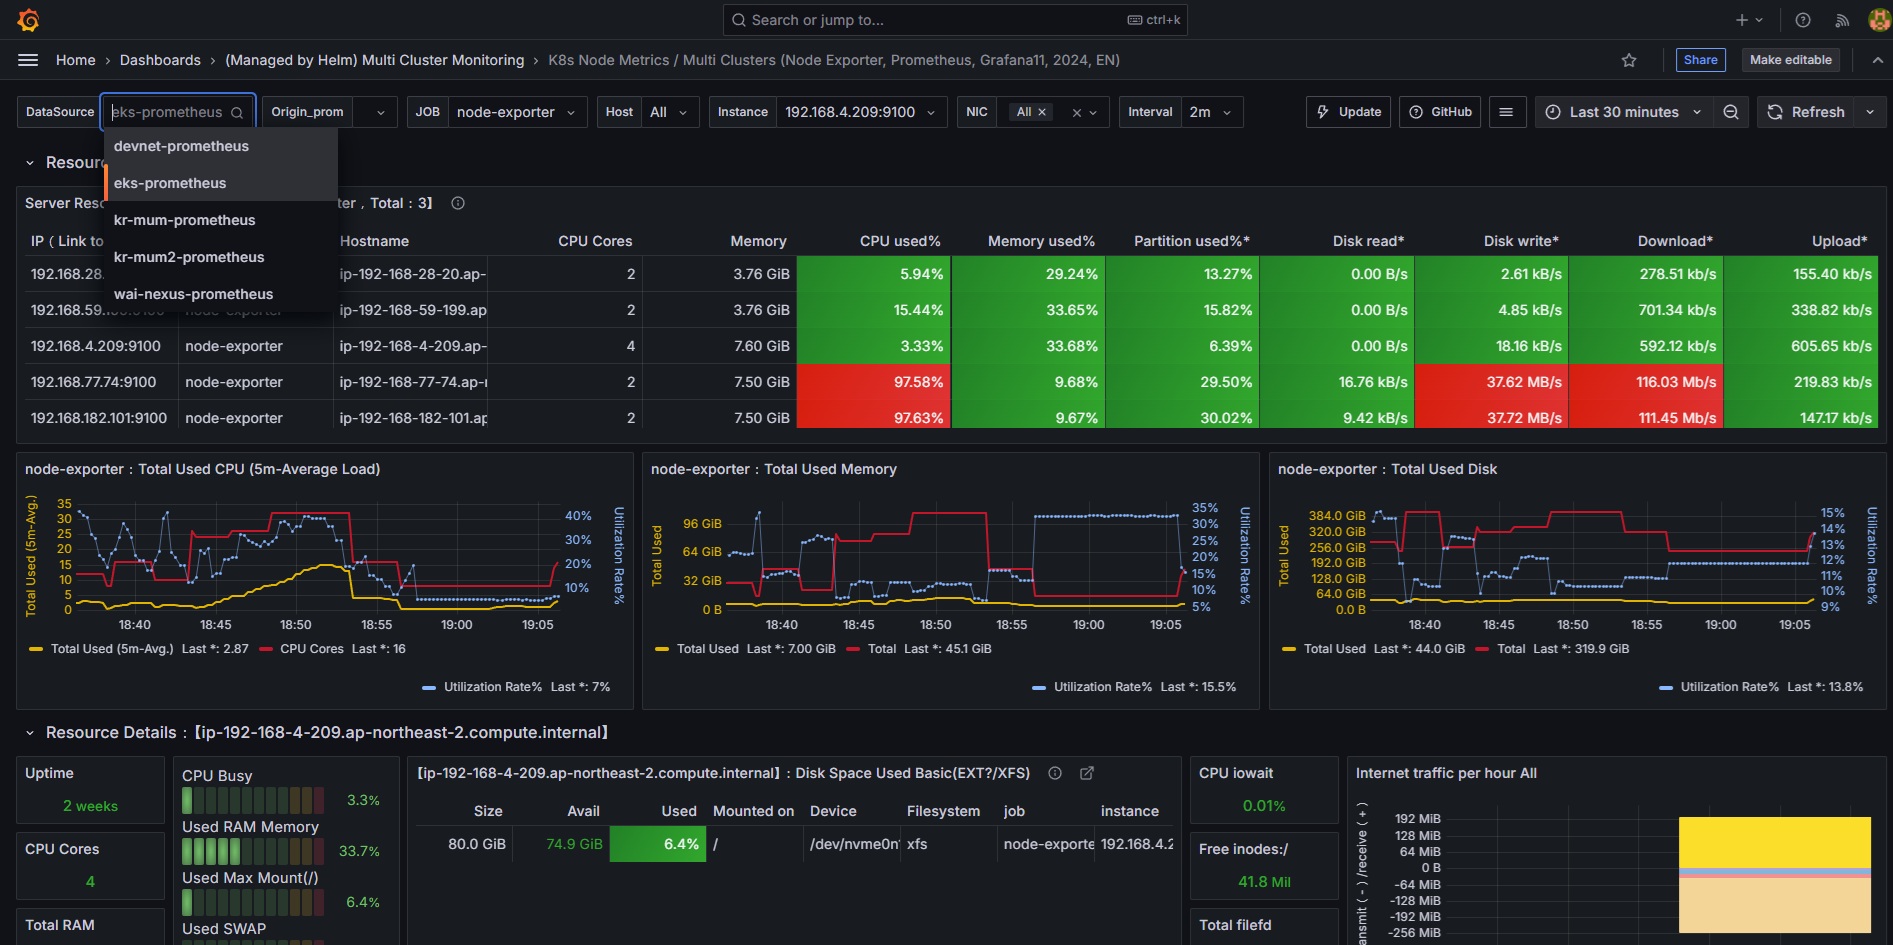
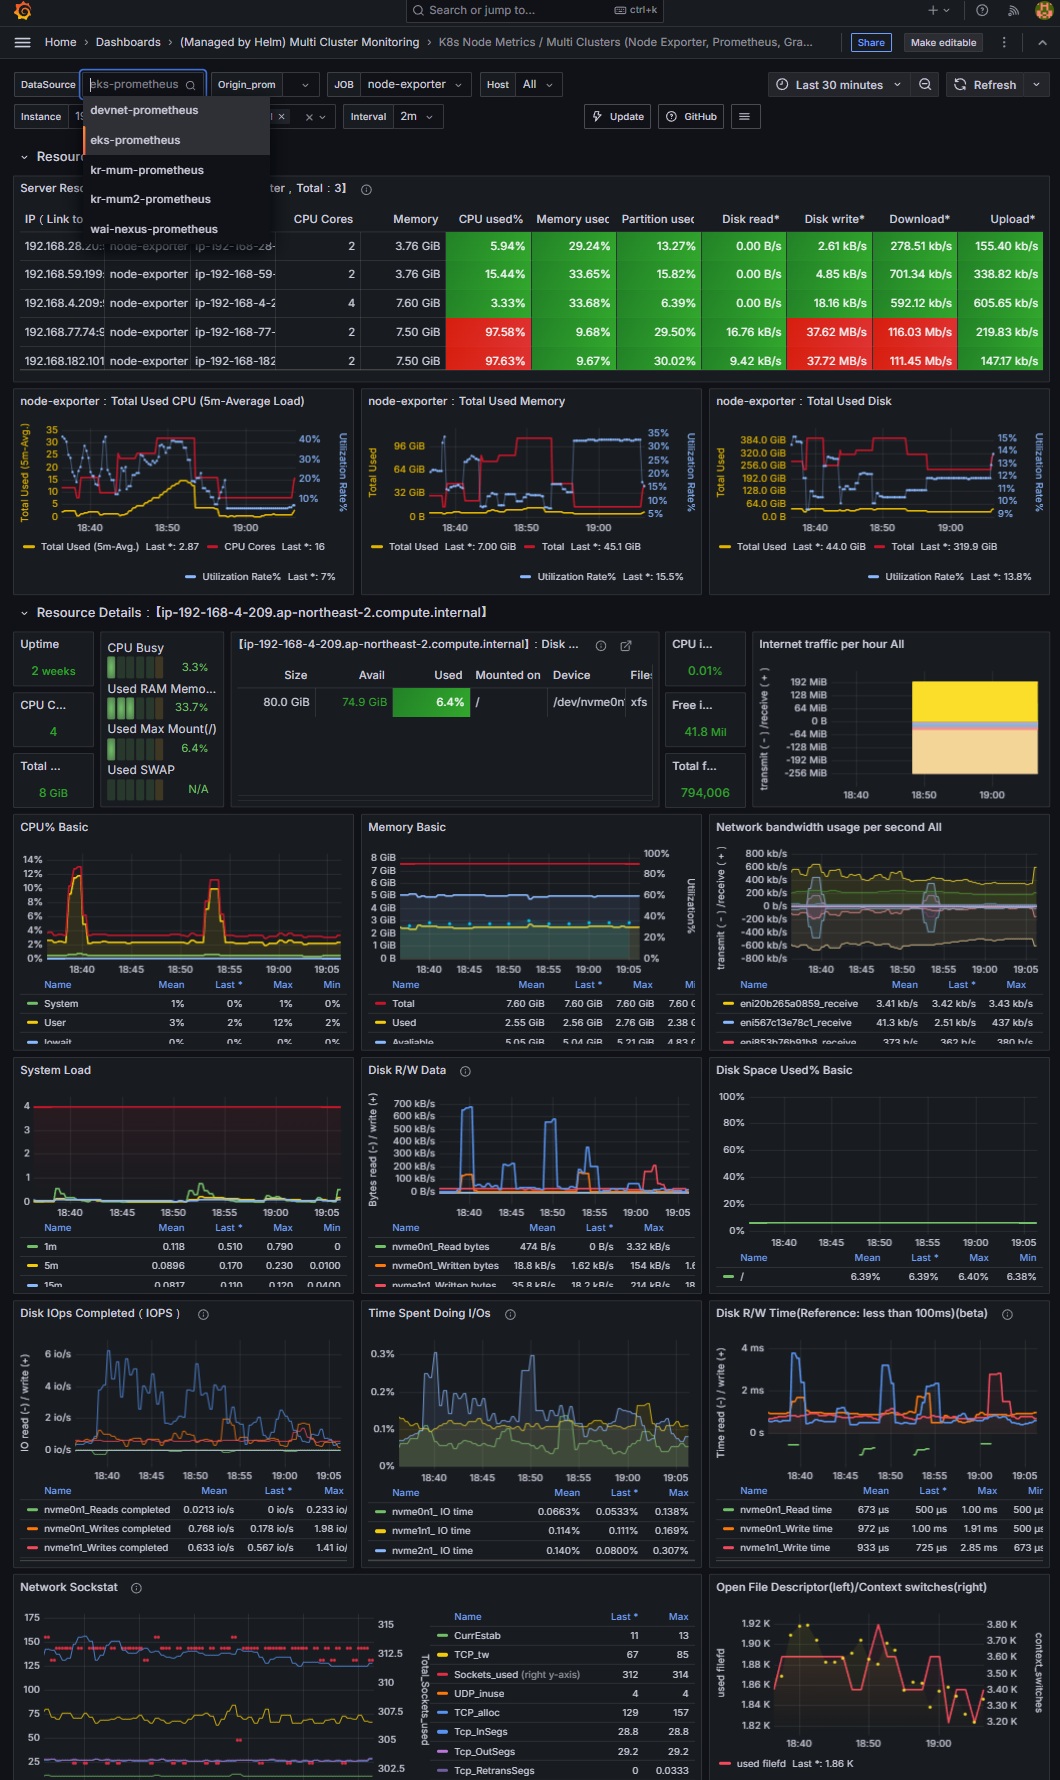
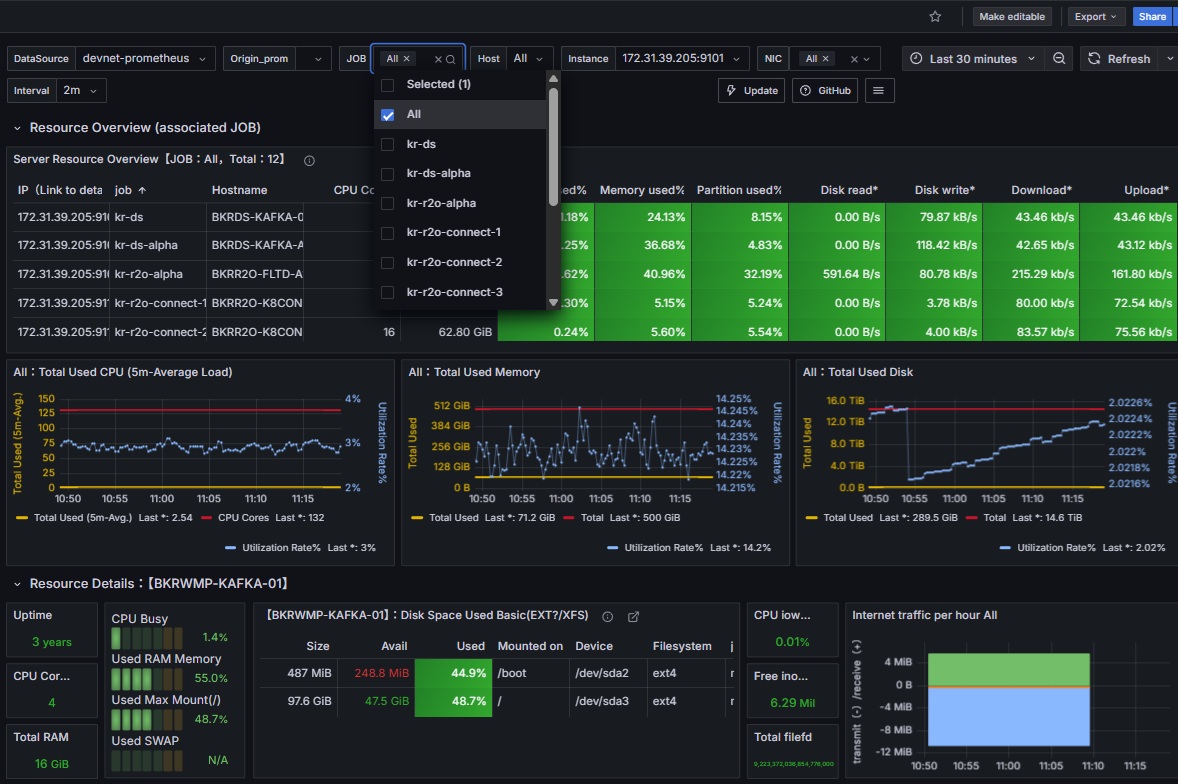
- Support Dynamic Selection for Multi-DataSource(Prometheus)
- Support English
- 11074's style is very useful. Also, 11074's publisher supports other advanced dashboards(like 16098)
- BUT, they only support Chinese in the latest Grafana.
- Default Settings of Table minWidth for Vertical Mode
- Modify the design of some panels
- Total CPU, Total Memory, Total Disk
- Delete Links
- Redirection via Link URL is unstable in the latest Grafana. Please just use label selection.
UseCase
- We are operating multiple Kubernetes clusters, and have deployed node-exporter and prometheus to each cluster using the kube-prometheus-stack helm chart.
- We want to monitor metrics of multiple clusters in a centralized monitoring environment(1 dashboard, 1 Grafana).
Used Metrics 4444
-
node_uname_info
-
node_boot_time_seconds
-
node_memory_MemTotal_bytes
-
node_cpu_seconds_total
-
node_load5
interval
-
node_memory_MemAvailable_bytes
-
node_filesystem_size_bytes
-
node_filesystem_free_bytes
-
node_filesystem_avail_bytes
-
node_disk_read_bytes_total
-
node_disk_written_bytes_total
-
node_netstat_Tcp_CurrEstab
-
node_sockstat_TCP_tw
-
node_network_receive_bytes_total
-
node_network_transmit_bytes_total
-
node_memory_SwapFree_bytes
-
node_memory_SwapTotal_bytes
-
node_filesystem_files_free
-
node_filefd_maximum
-
node_memory_Buffers_bytes
-
node_memory_MemFree_bytes
-
node_memory_Cached_bytes
-
node_load1
-
node_load15
-
node_filesystem_files
-
node_disk_reads_completed_total
-
node_disk_writes_completed_total
-
node_disk_io_now
-
node_disk_io_time_seconds_total
-
node_disk_read_time_seconds_total
-
node_disk_write_time_seconds_total
-
node_disk_io_time_weighted_seconds_total
-
node_sockstat_sockets_used
-
node_sockstat_UDP_inuse
-
node_sockstat_TCP_alloc
-
node_netstat_Tcp_PassiveOpens
-
node_netstat_Tcp_ActiveOpens
-
node_netstat_Tcp_InSegs
-
node_netstat_Tcp_OutSegs
-
node_netstat_Tcp_RetransSegs
-
node_netstat_TcpExt_ListenDrops
-
node_filefd_allocated
-
node_context_switches_total