Linux Server Overview 803803
11/9/2023
8/22/2024
8
>=11.0.0
Prometheus
Monitor Linux Server with Prometheus and Grafana
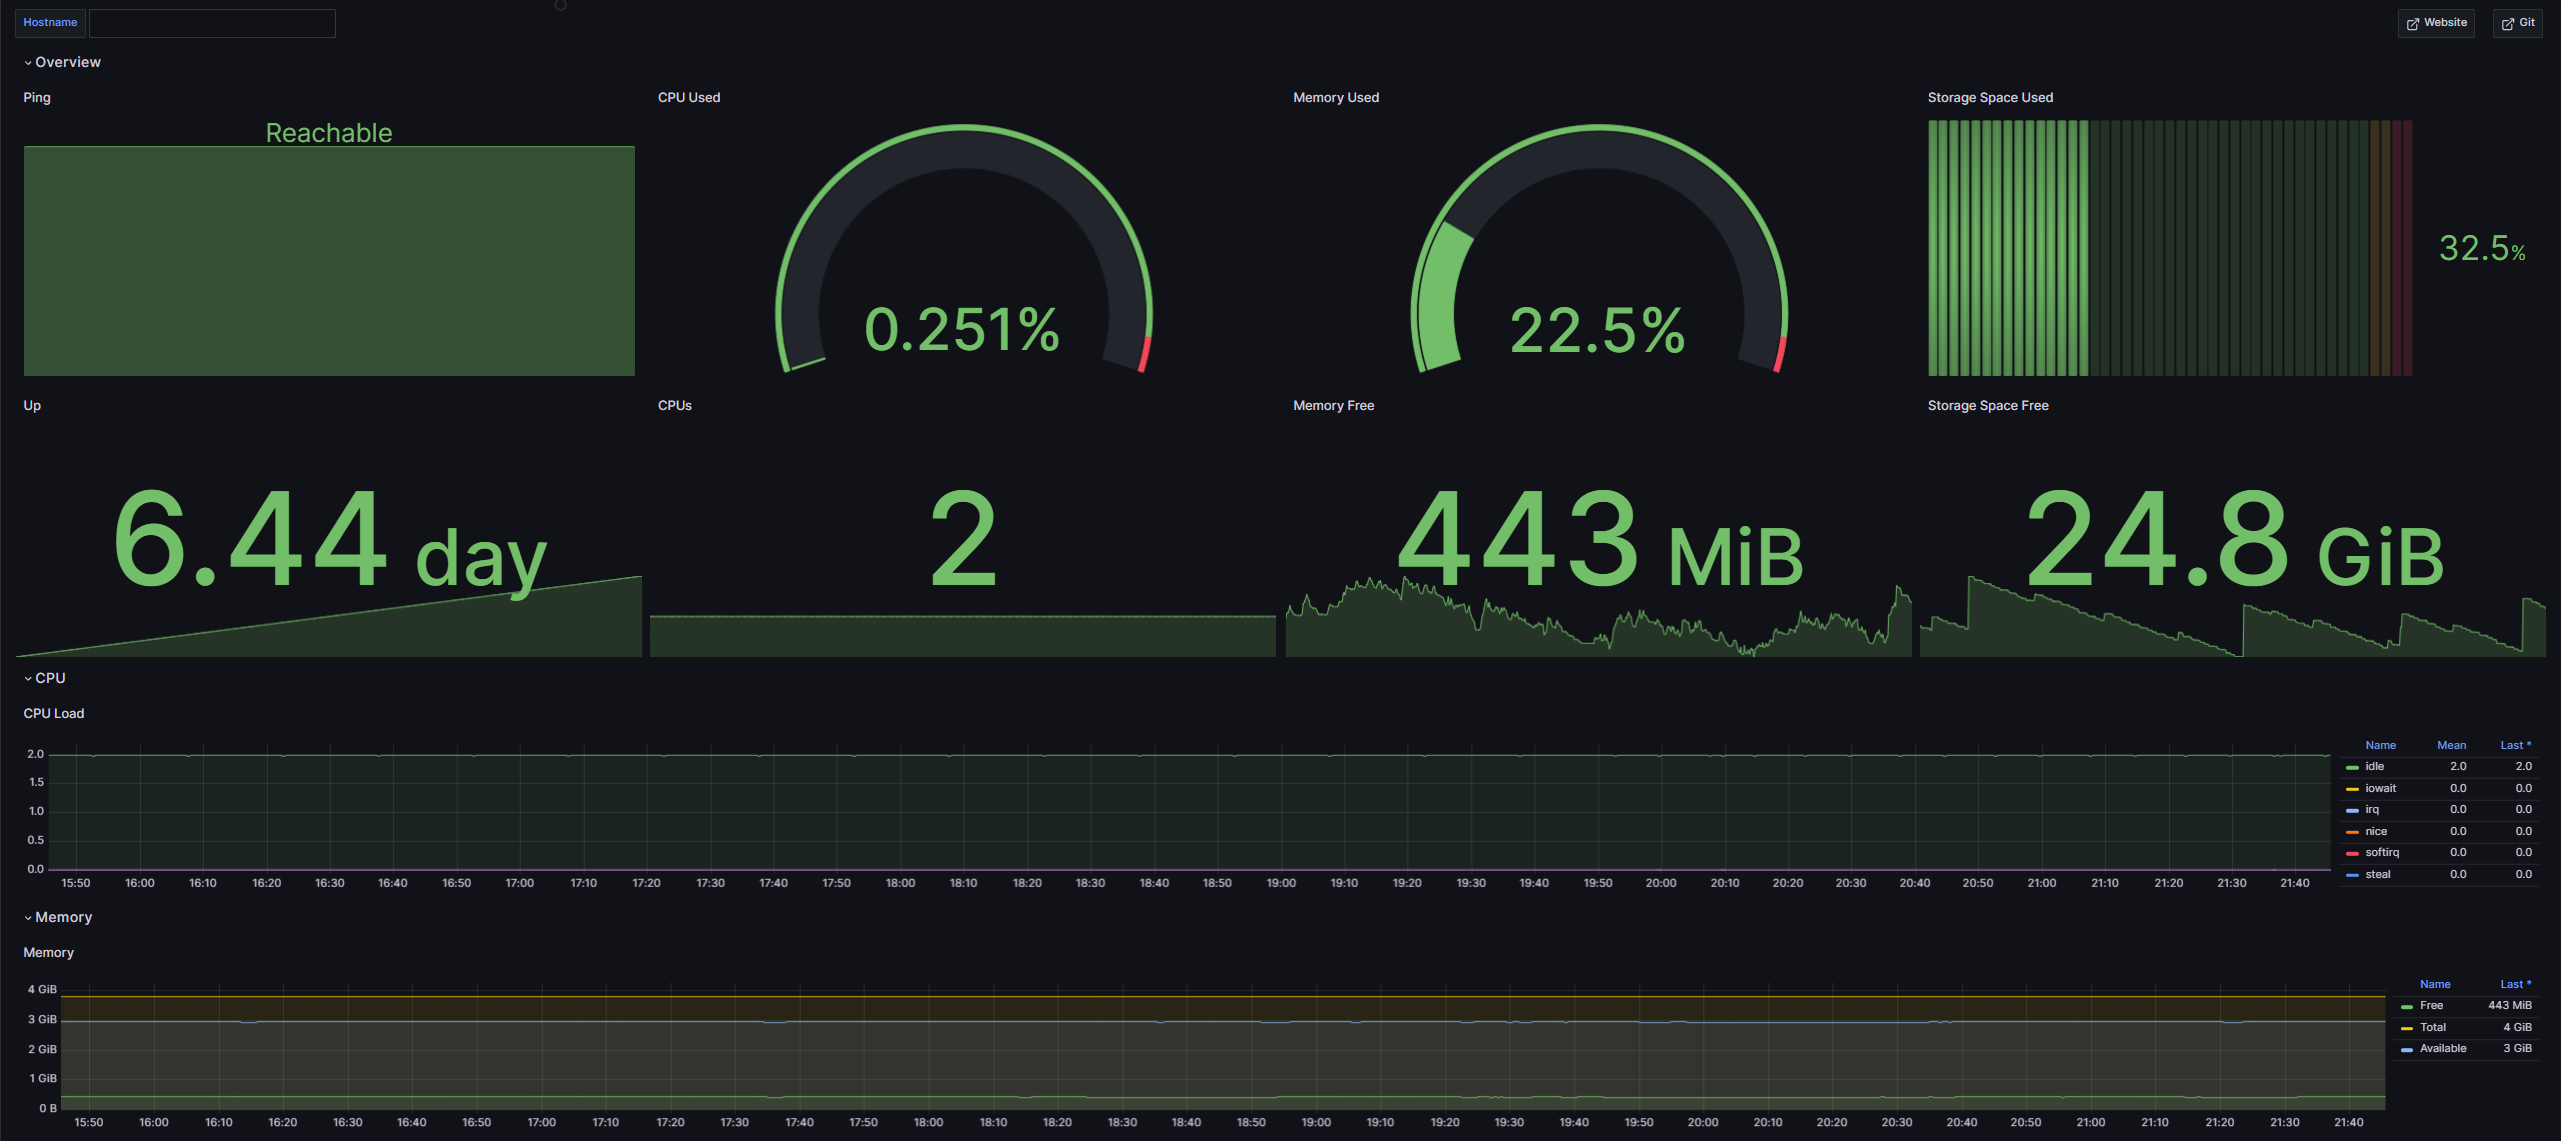
Once you import the Linux Server Overview Dashboard, it should appear as shown (please note that some data has been blacked out in the images for privacy reasons). In this dashboard, you can see the current metrics of your Linux server:
- Ping (Is the server up?)
- Up (Since when has the server been running?)
- CPU Used (How much of the CPU is currently used in percent)
- CPUs (How many CPUs does your server have?)
- Memory Used (How much memory is used in percent)
- Memory Free (How much memory is free in bytes)
- Storage Space Used (How much storage is used in percent)
- Storage Space Free (How much storage is free in bytes)
You can also see how some metrics have changed over time:
- CPU Load (How has the CPU load changed over time?)
- Memory (How has the free memory changed over time?)
- Disk Free (How has the free disk space changed over time?)
You can find more information here: Git
Export Dashboard✕
Download
Copy to Clipboard