cAdvisor Docker Insights 6,6016,601
11/5/2023
11/5/2023
1
Docker
>=10.2.0
Prometheus
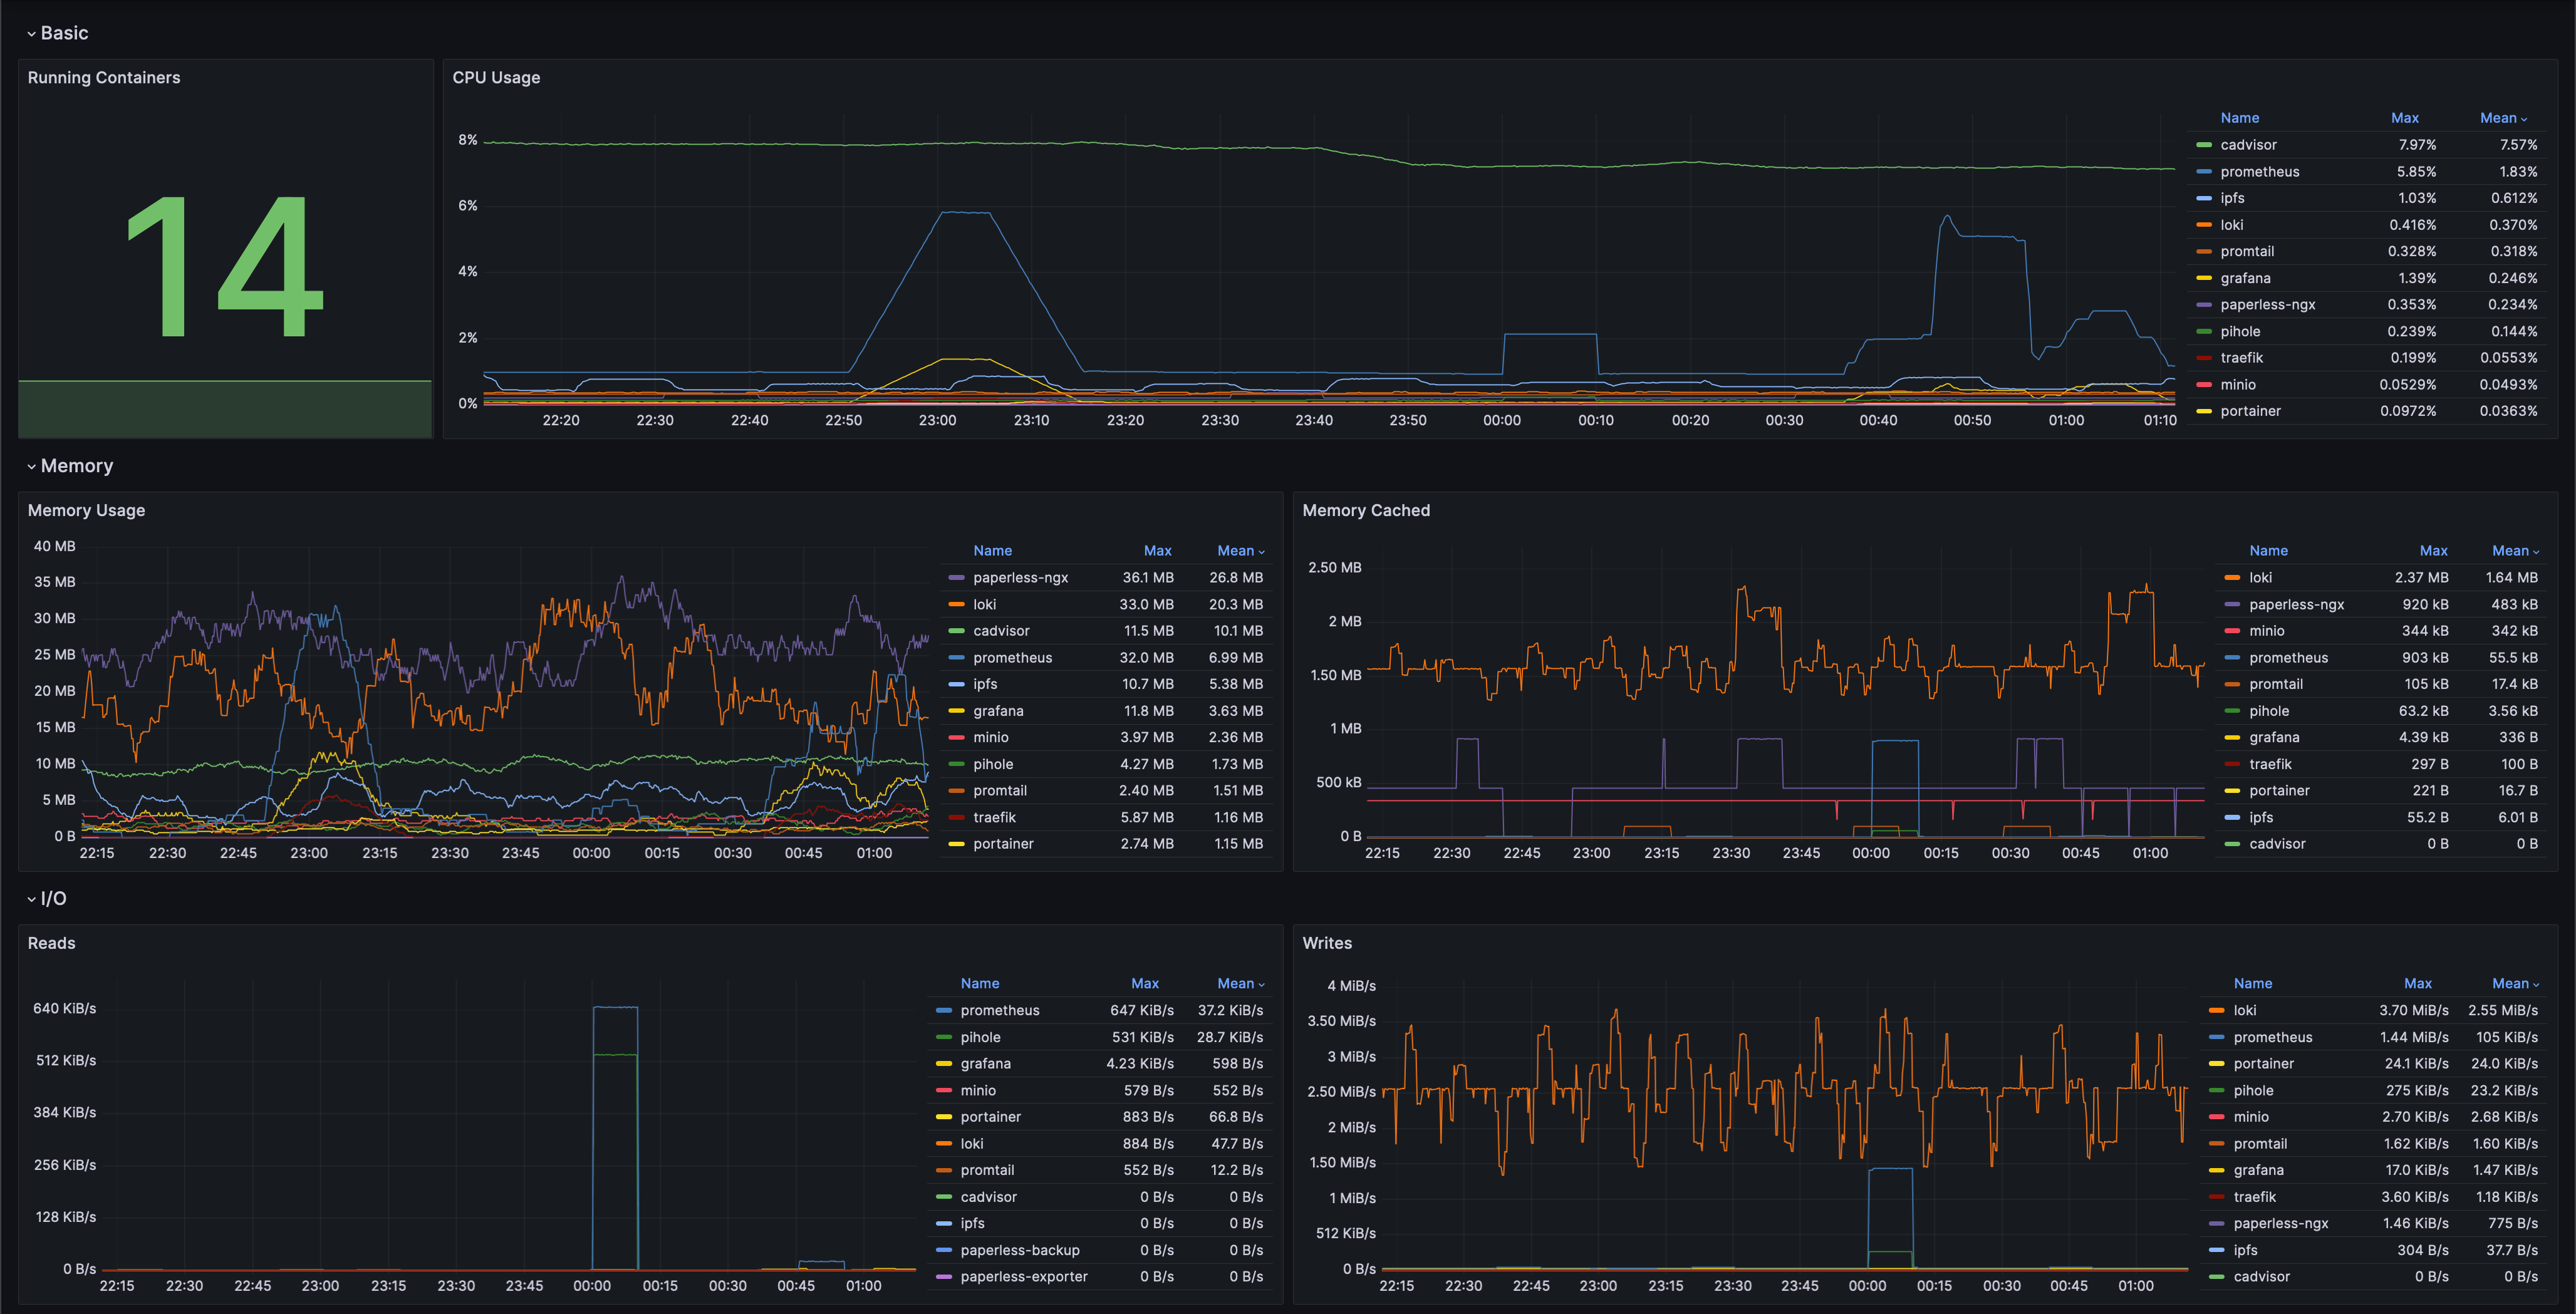
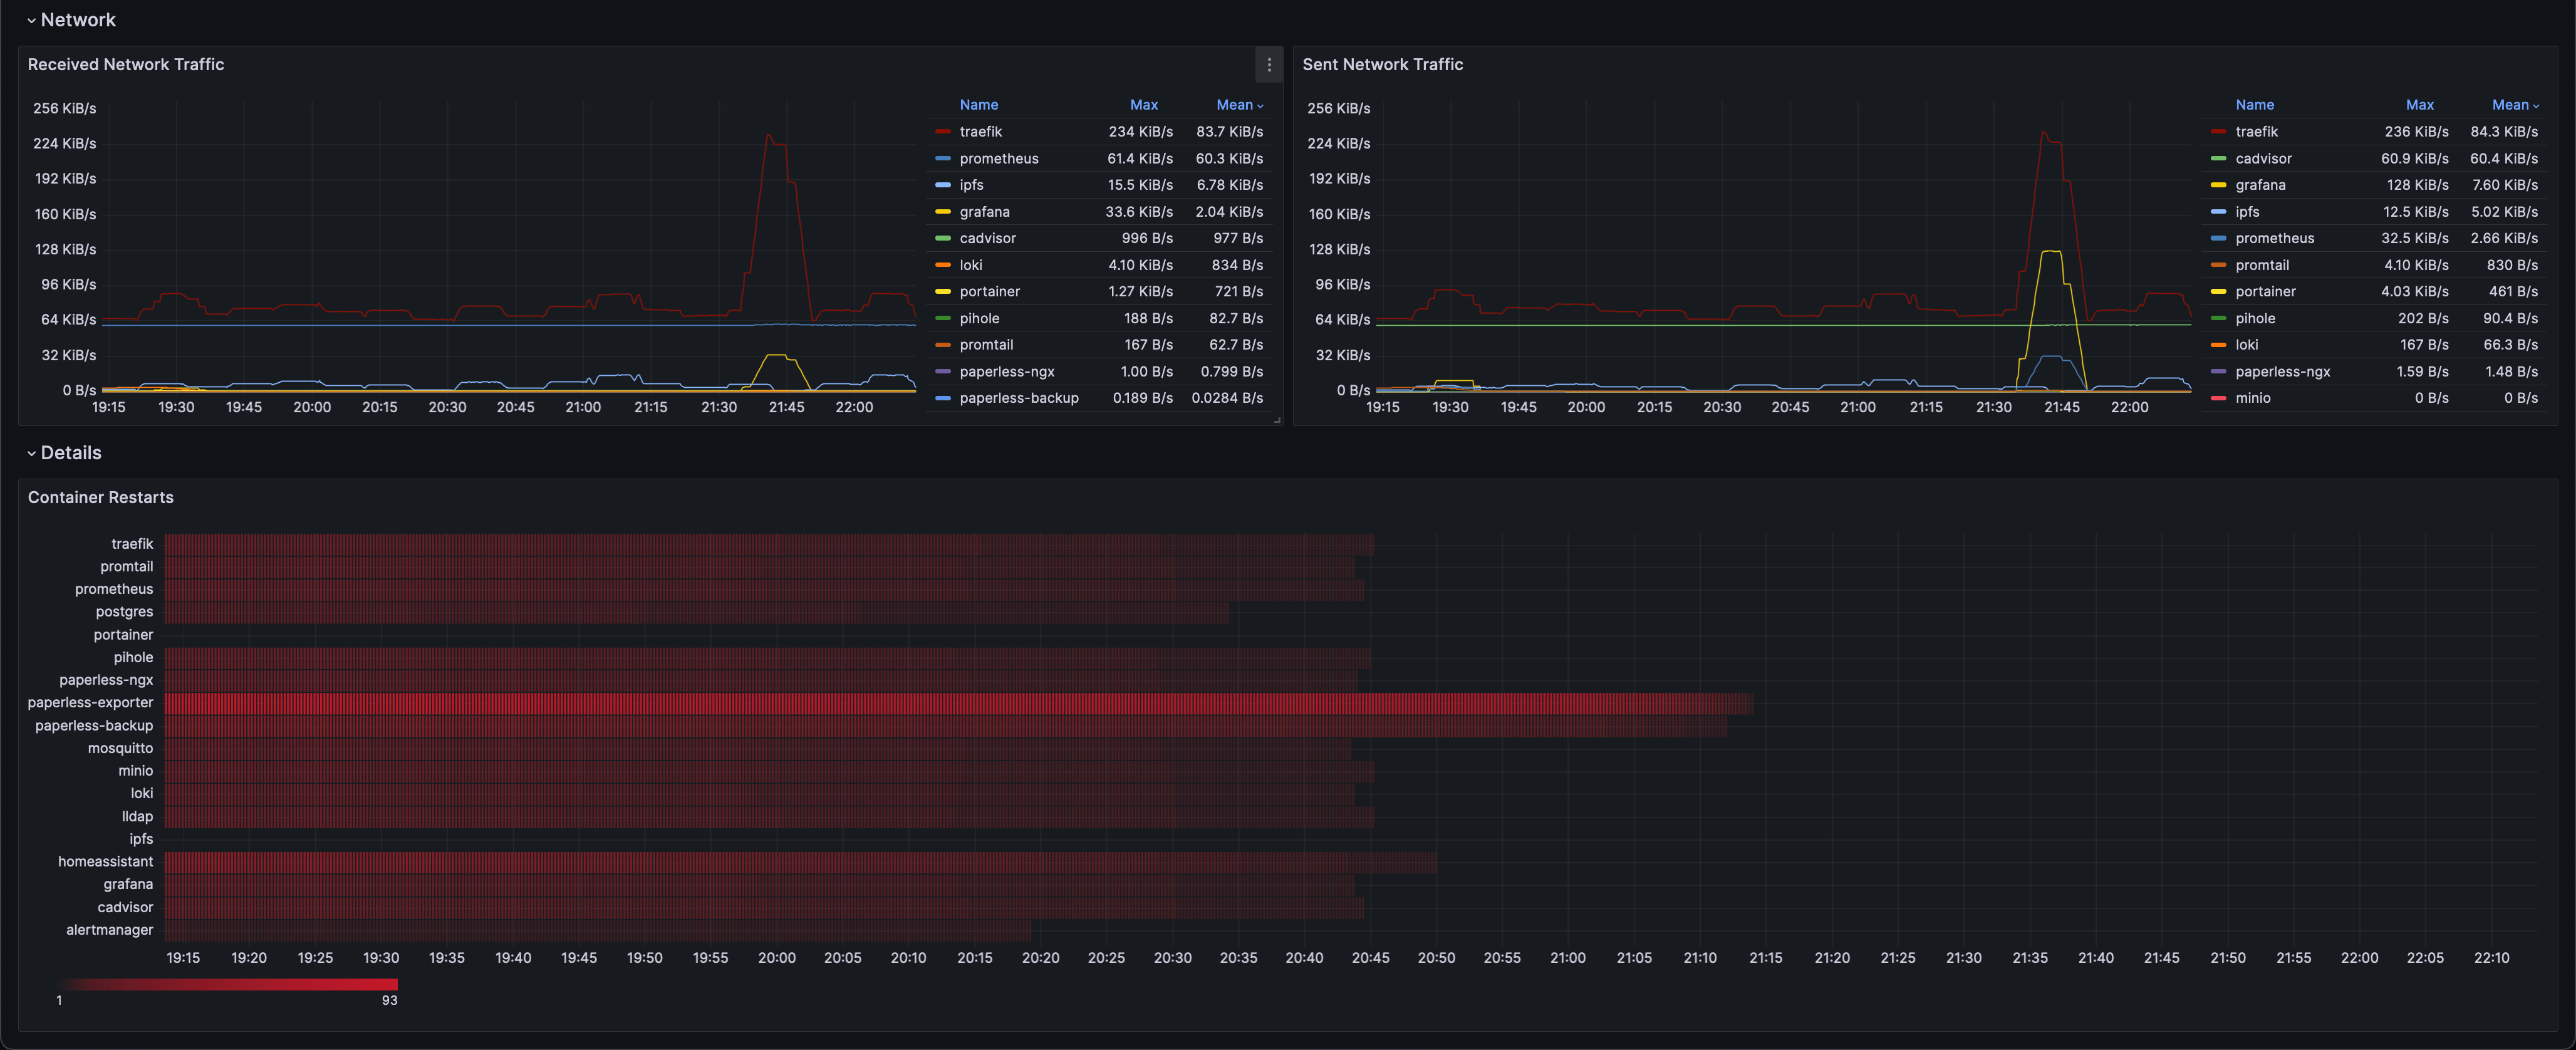
This Grafana dashboard offers a basic overview of key performance metrics for Docker containers in your system. By utilizing Prometheus for data collection and cAdvisor for container-specific insights, it provides a clear view of CPU, memory, I/O, and container restarts, allowing you to monitor and manage your containerized environment effectively.
Export Dashboard✕
Download
Copy to Clipboard