Spring Boot 3.x Statistics 18,21118,211
6/20/2023
6/20/2023
1
>=9.5.1
Prometheus
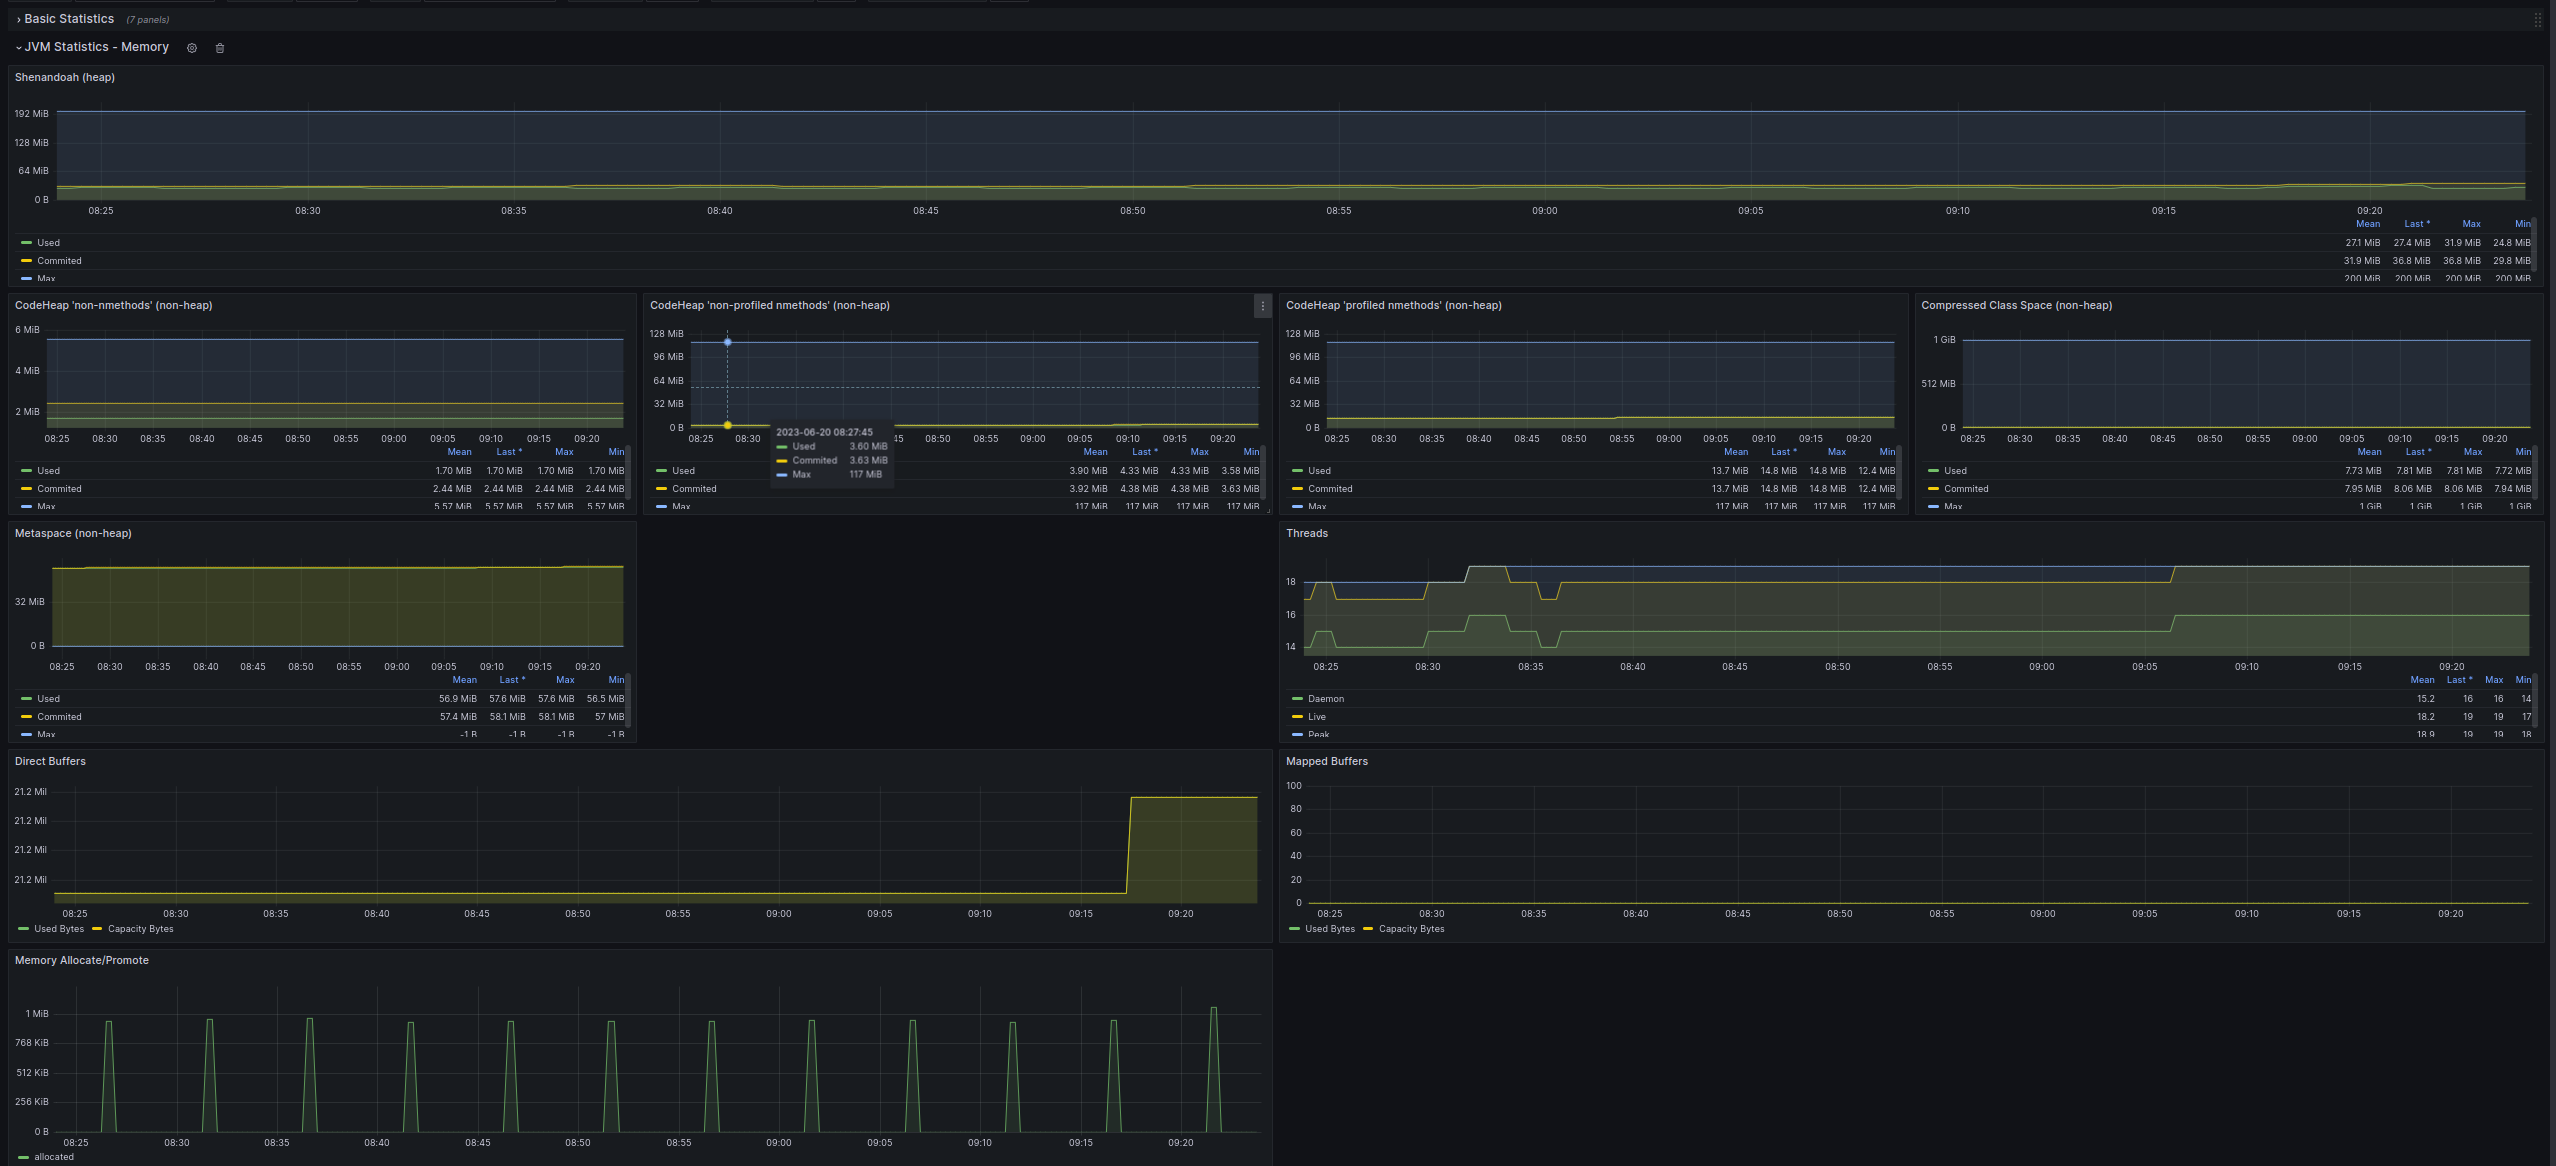
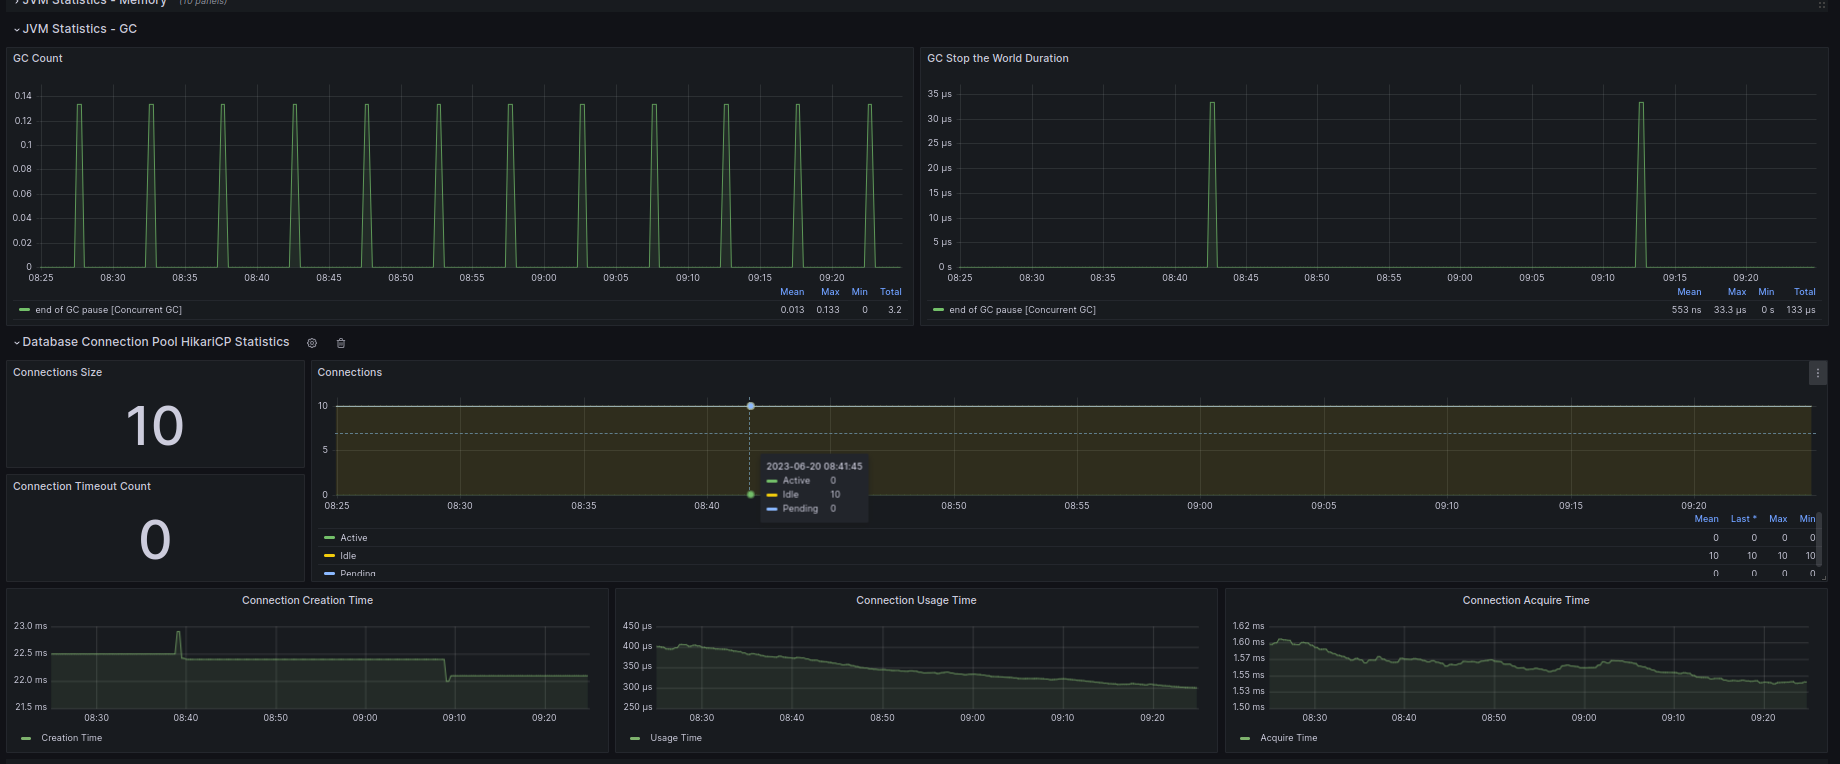
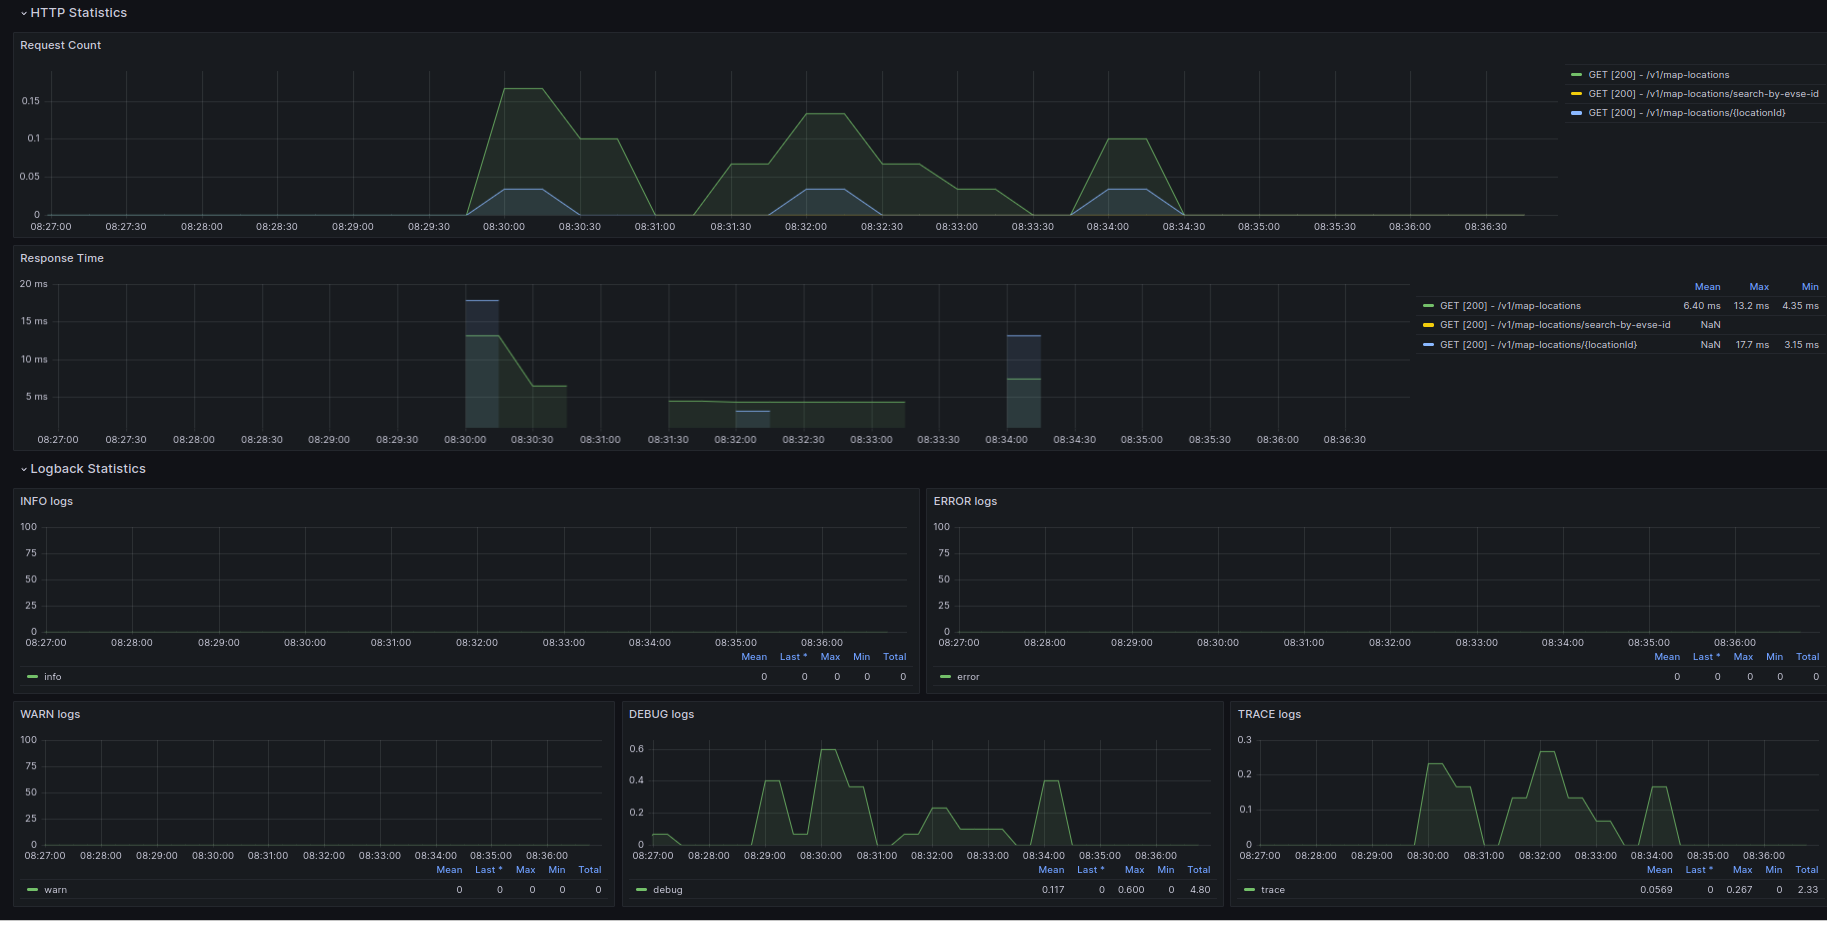
All rounded Spring Boot 3.x Grafana Dashboard suitable for Micrometer Prometheus metrics. https://micrometer.io/docs/registry/prometheus
Export Dashboard✕
Download
Copy to Clipboard
Used Metrics 99
process_uptime_seconds
jvm_memory_used_bytes
jvm_memory_max_bytes
process_files_open_files
-
process_start_time_seconds
system_cpu_usage
process_cpu_usage
system_load_average_
system_cpu_count