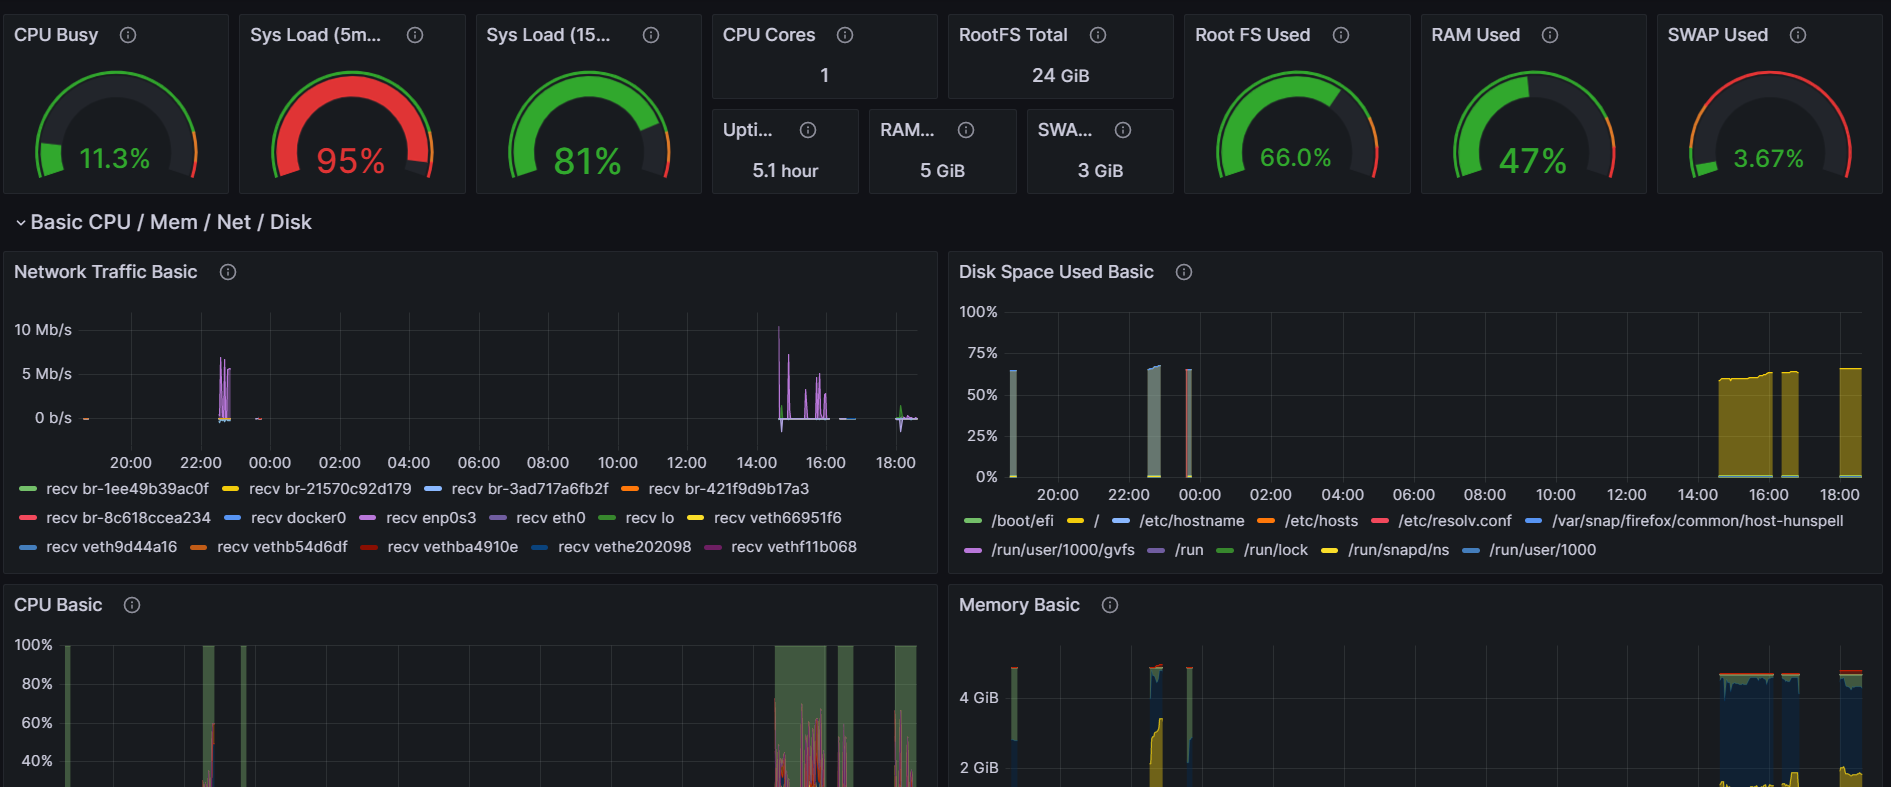
System Usage 1,1351,135
Only requires the default job_name: node and target[addrs:portno] in prometheus.yml file. By default it take metrics form localhost:9100/metrics
  - job_name: node
    static_configs:
      - targets: ['localhost:9100']
If the metrics are available at a specific path other than the default, it needs to be defined in the configuration file.
scrape_configs:
  - job_name: "node"
    static_configs:
      - targets: ["localhost:9100"]
    metrics_path: "/some/path"
Recommended for prometheus-node-exporter the arguments ‘–collector.systemd –collector.processes’ because the graph uses some of their metrics
Used Metrics 1717
-
node_cpu_seconds_total
-
node_load5
-
node_load15
-
node_filesystem_size_bytes
-
node_filesystem_avail_bytes
-
node_memory_MemTotal_bytes
-
node_memory_MemFree_bytes
-
node_memory_MemAvailable_bytes
-
node_memory_SwapTotal_bytes
-
node_memory_SwapFree_bytes
-
node_time_seconds
-
node_boot_time_seconds
-
node_memory_Cached_bytes
-
node_memory_Buffers_bytes
-
node_memory_SReclaimable_bytes
-
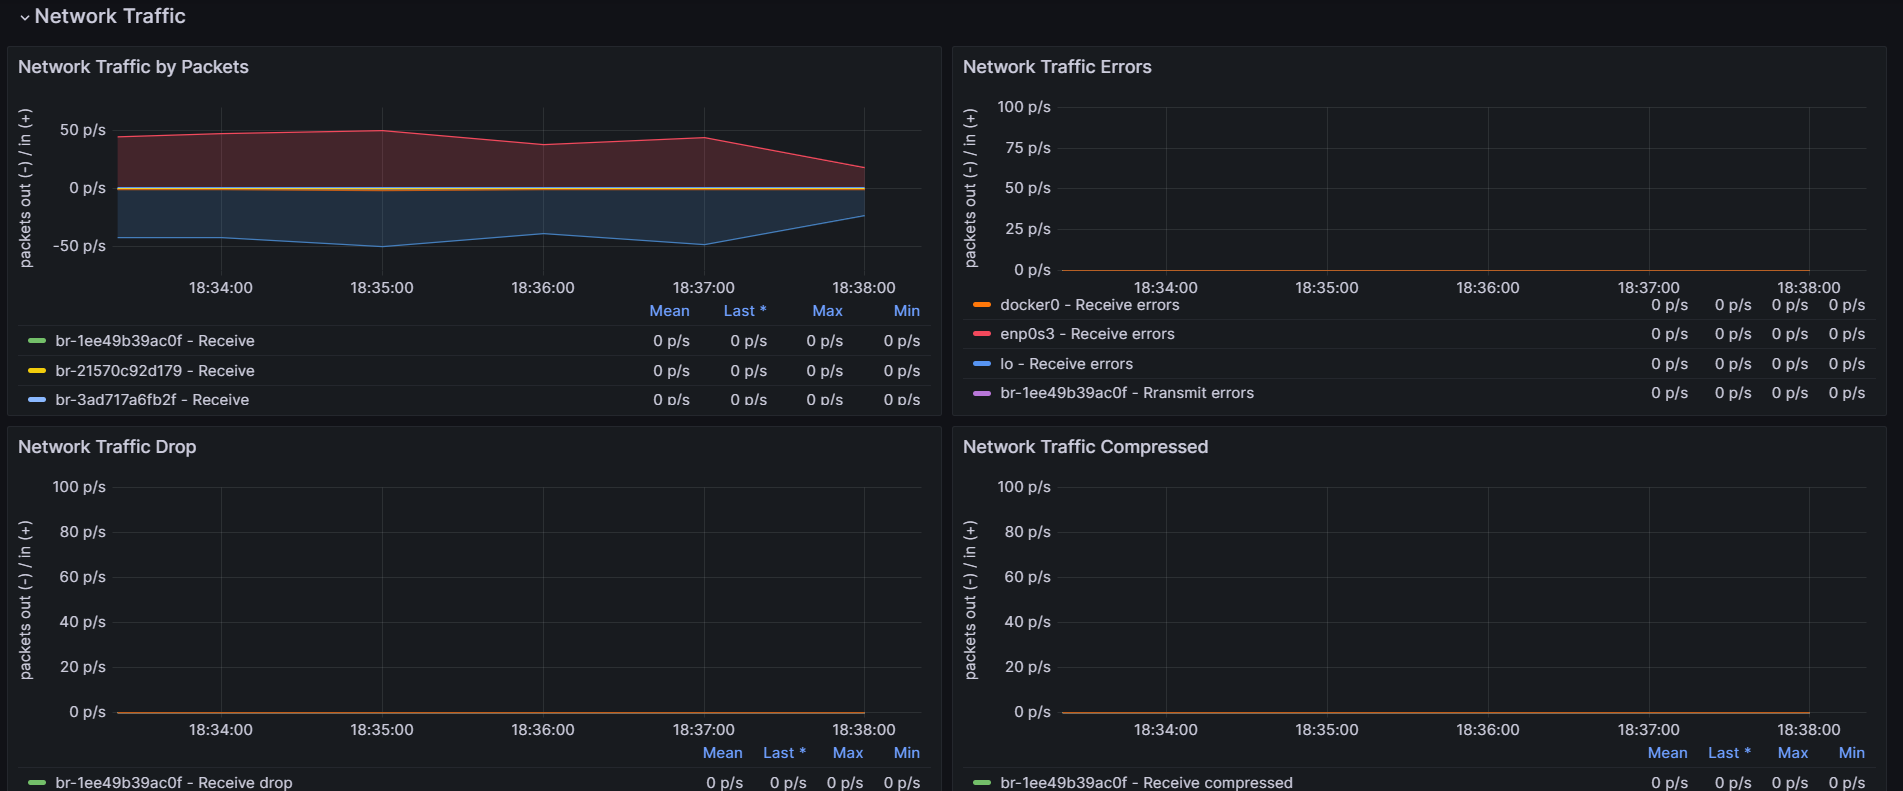
node_network_receive_bytes_total
-
node_network_transmit_bytes_total