Kafka Dashboard 6,8956,895
使用jmx_exporter对kafka进行监控
Use jmx_exporter to collect Kafka metrics
导入jmx_prometheus_javaagent-0.18.0.jar和config.yml
Use jmx_prometheus_javaagent-0.18.0.jar and edit config.yml
windows启动kafka-javaagent startwithagent.bat的启动脚本
Edit kafka-javaagent startwithagent.bat for Windows system to start kafka, Such as:
SET KAFKA_HOME=E:\kafka_2.12-2.8.1
SET KAFKA_OPTS=-javaagent:%KAFKA_HOME%\jmx_prometheus_javaagent-0.18.0.jar=6660:%KAFKA_HOME%\config.yml

cd %KAFKA_HOME%\bin\windows

kafka-server-start.bat %KAFKA_HOME%\config\server.properties
config.yml内容(如果不添加任何指定监控项为默认值):
lowercaseOutputName: true

rules:
# Special cases and very specific rules
- pattern : kafka.server<type=(.+), name=(.+), clientId=(.+), topic=(.+), partition=(.*)><>Value
  name: kafka_server_$1_$2
  type: GAUGE
  labels:
    clientId: "$3"
    topic: "$4"
    partition: "$5"
- pattern : kafka.server<type=(.+), name=(.+), clientId=(.+), brokerHost=(.+), brokerPort=(.+)><>Value
  name: kafka_server_$1_$2
  type: GAUGE
  labels:
    clientId: "$3"
    broker: "$4:$5"
- pattern : kafka.coordinator.(\w+)<type=(.+), name=(.+)><>Value
  name: kafka_coordinator_$1_$2_$3
  type: GAUGE

# Generic per-second counters with 0-2 key/value pairs
- pattern: kafka.(\w+)<type=(.+), name=(.+)PerSec\w*, (.+)=(.+), (.+)=(.+)><>Count
  name: kafka_$1_$2_$3_total
  type: COUNTER
  labels:
    "$4": "$5"
    "$6": "$7"
- pattern: kafka.(\w+)<type=(.+), name=(.+)PerSec\w*, (.+)=(.+)><>Count
  name: kafka_$1_$2_$3_total
  type: COUNTER
  labels:
    "$4": "$5"
- pattern: kafka.(\w+)<type=(.+), name=(.+)PerSec\w*><>Count
  name: kafka_$1_$2_$3_total
  type: COUNTER

- pattern: kafka.server<type=(.+), client-id=(.+)><>([a-z-]+)
  name: kafka_server_quota_$3
  type: GAUGE
  labels:
    resource: "$1"
    clientId: "$2"

- pattern: kafka.server<type=(.+), user=(.+), client-id=(.+)><>([a-z-]+)
  name: kafka_server_quota_$4
  type: GAUGE
  labels:
    resource: "$1"
    user: "$2"
    clientId: "$3"

# Generic gauges with 0-2 key/value pairs
- pattern: kafka.(\w+)<type=(.+), name=(.+), (.+)=(.+), (.+)=(.+)><>Value
  name: kafka_$1_$2_$3
  type: GAUGE
  labels:
    "$4": "$5"
    "$6": "$7"
- pattern: kafka.(\w+)<type=(.+), name=(.+), (.+)=(.+)><>Value
  name: kafka_$1_$2_$3
  type: GAUGE
  labels:
    "$4": "$5"
- pattern: kafka.(\w+)<type=(.+), name=(.+)><>Value
  name: kafka_$1_$2_$3
  type: GAUGE

# Emulate Prometheus 'Summary' metrics for the exported 'Histogram's.
#
# Note that these are missing the '_sum' metric!
- pattern: kafka.(\w+)<type=(.+), name=(.+), (.+)=(.+), (.+)=(.+)><>Count
  name: kafka_$1_$2_$3_count
  type: COUNTER
  labels:
    "$4": "$5"
    "$6": "$7"
- pattern: kafka.(\w+)<type=(.+), name=(.+), (.+)=(.*), (.+)=(.+)><>(\d+)thPercentile
  name: kafka_$1_$2_$3
  type: GAUGE
  labels:
    "$4": "$5"
    "$6": "$7"
    quantile: "0.$8"
- pattern: kafka.(\w+)<type=(.+), name=(.+), (.+)=(.+)><>Count
  name: kafka_$1_$2_$3_count
  type: COUNTER
  labels:
    "$4": "$5"
- pattern: kafka.(\w+)<type=(.+), name=(.+), (.+)=(.*)><>(\d+)thPercentile
  name: kafka_$1_$2_$3
  type: GAUGE
  labels:
    "$4": "$5"
    quantile: "0.$6"
- pattern: kafka.(\w+)<type=(.+), name=(.+)><>Count
  name: kafka_$1_$2_$3_count
  type: COUNTER
- pattern: kafka.(\w+)<type=(.+), name=(.+)><>(\d+)thPercentile
  name: kafka_$1_$2_$3
  type: GAUGE
  labels:
    quantile: "0.$4"
linux启动添加类似脚本或者改动启动文件:
Edit start.sh:
KAFKA_HOME=/xxx/kafka_2.12-2.8.1
export KAFKA_OPTS=-javaagent:$KAFKA_HOME/jmx_prometheus_javaagent-0.18.0.jar=6660:$KAFKA_HOME/config.yml

$KAFKA_HOME/bin/kafka-server-start.sh -daemon $KAFKA_HOME/config/server.properties
添加配置至prometheus
Edit prometheus.yml
在prometheus.yml文件中添加:
- job_name: "kafka-jmx"

  # metrics_path defaults to '/metrics'
  # scheme defaults to 'http'.

  static_configs:
    - targets: ["{Prometheus Server}:6660"]
访问{Prometheus Server}6660/metrics查看指标
View http://{Prometheus Server}6660/metrics to checkout Kafka metrics
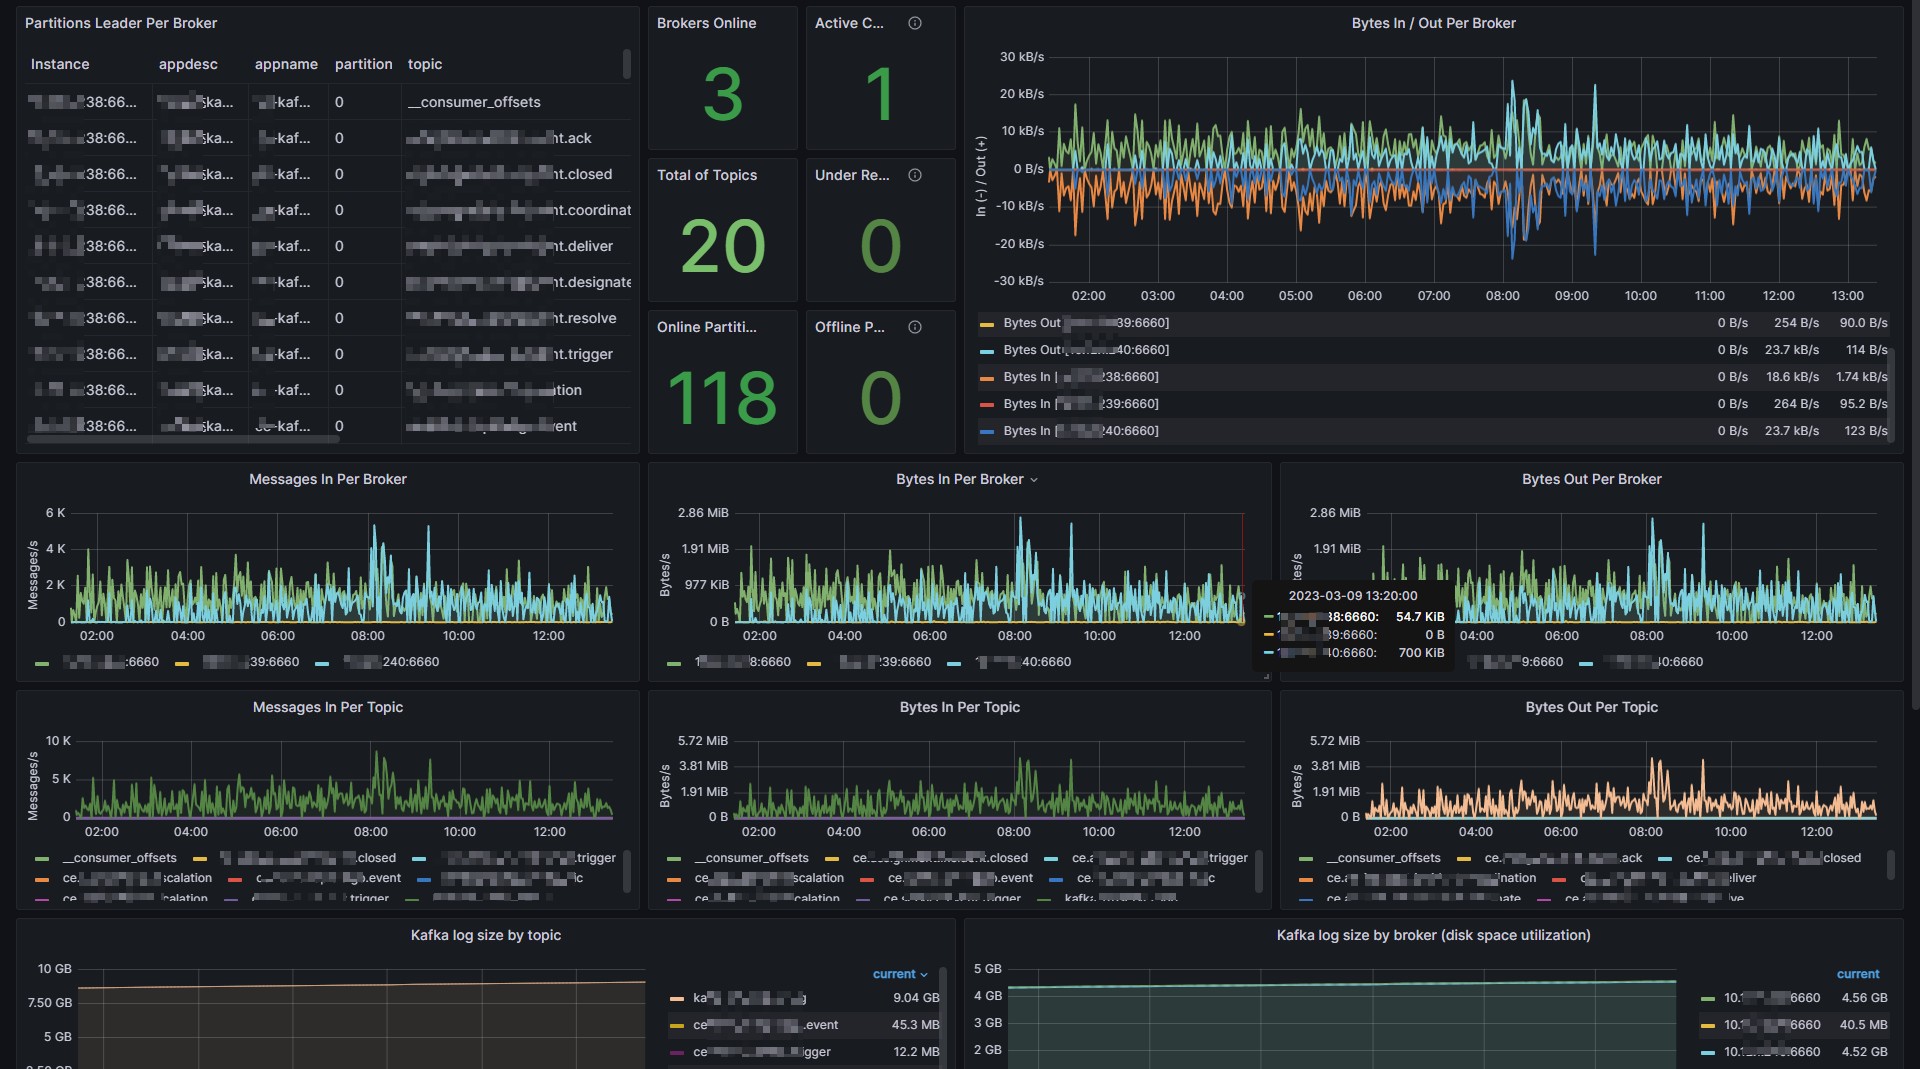
Used Metrics 1616
kafka_cluster_partition_replicascount
kafka_server_replicamanager_leadercount
kafka_controller_kafkacontroller_activecontrollercount
kafka_server_brokertopicmetrics_bytesout_total
kafka_server_brokertopicmetrics_bytesin_total
kafka_controller_kafkacontroller_globaltopiccount
kafka_server_replicamanager_underreplicatedpartitions
kafka_server_replicamanager_partitioncount
kafka_controller_kafkacontroller_offlinepartitionscount
kafka_server_brokertopicmetrics_messagesin_total
kafka_log_log_size
kafka_server_zookeeperclientmetrics_zookeeperrequestlatencyms
kafka_server_sessionexpirelistener_zookeeperexpires_total
kafka_server_sessionexpirelistener_zookeeperdisconnects_total
-
kafka_consumergroup_lag_sum
kafka_server_replicamanager_isrexpands_total