Unbound 76,02976,029
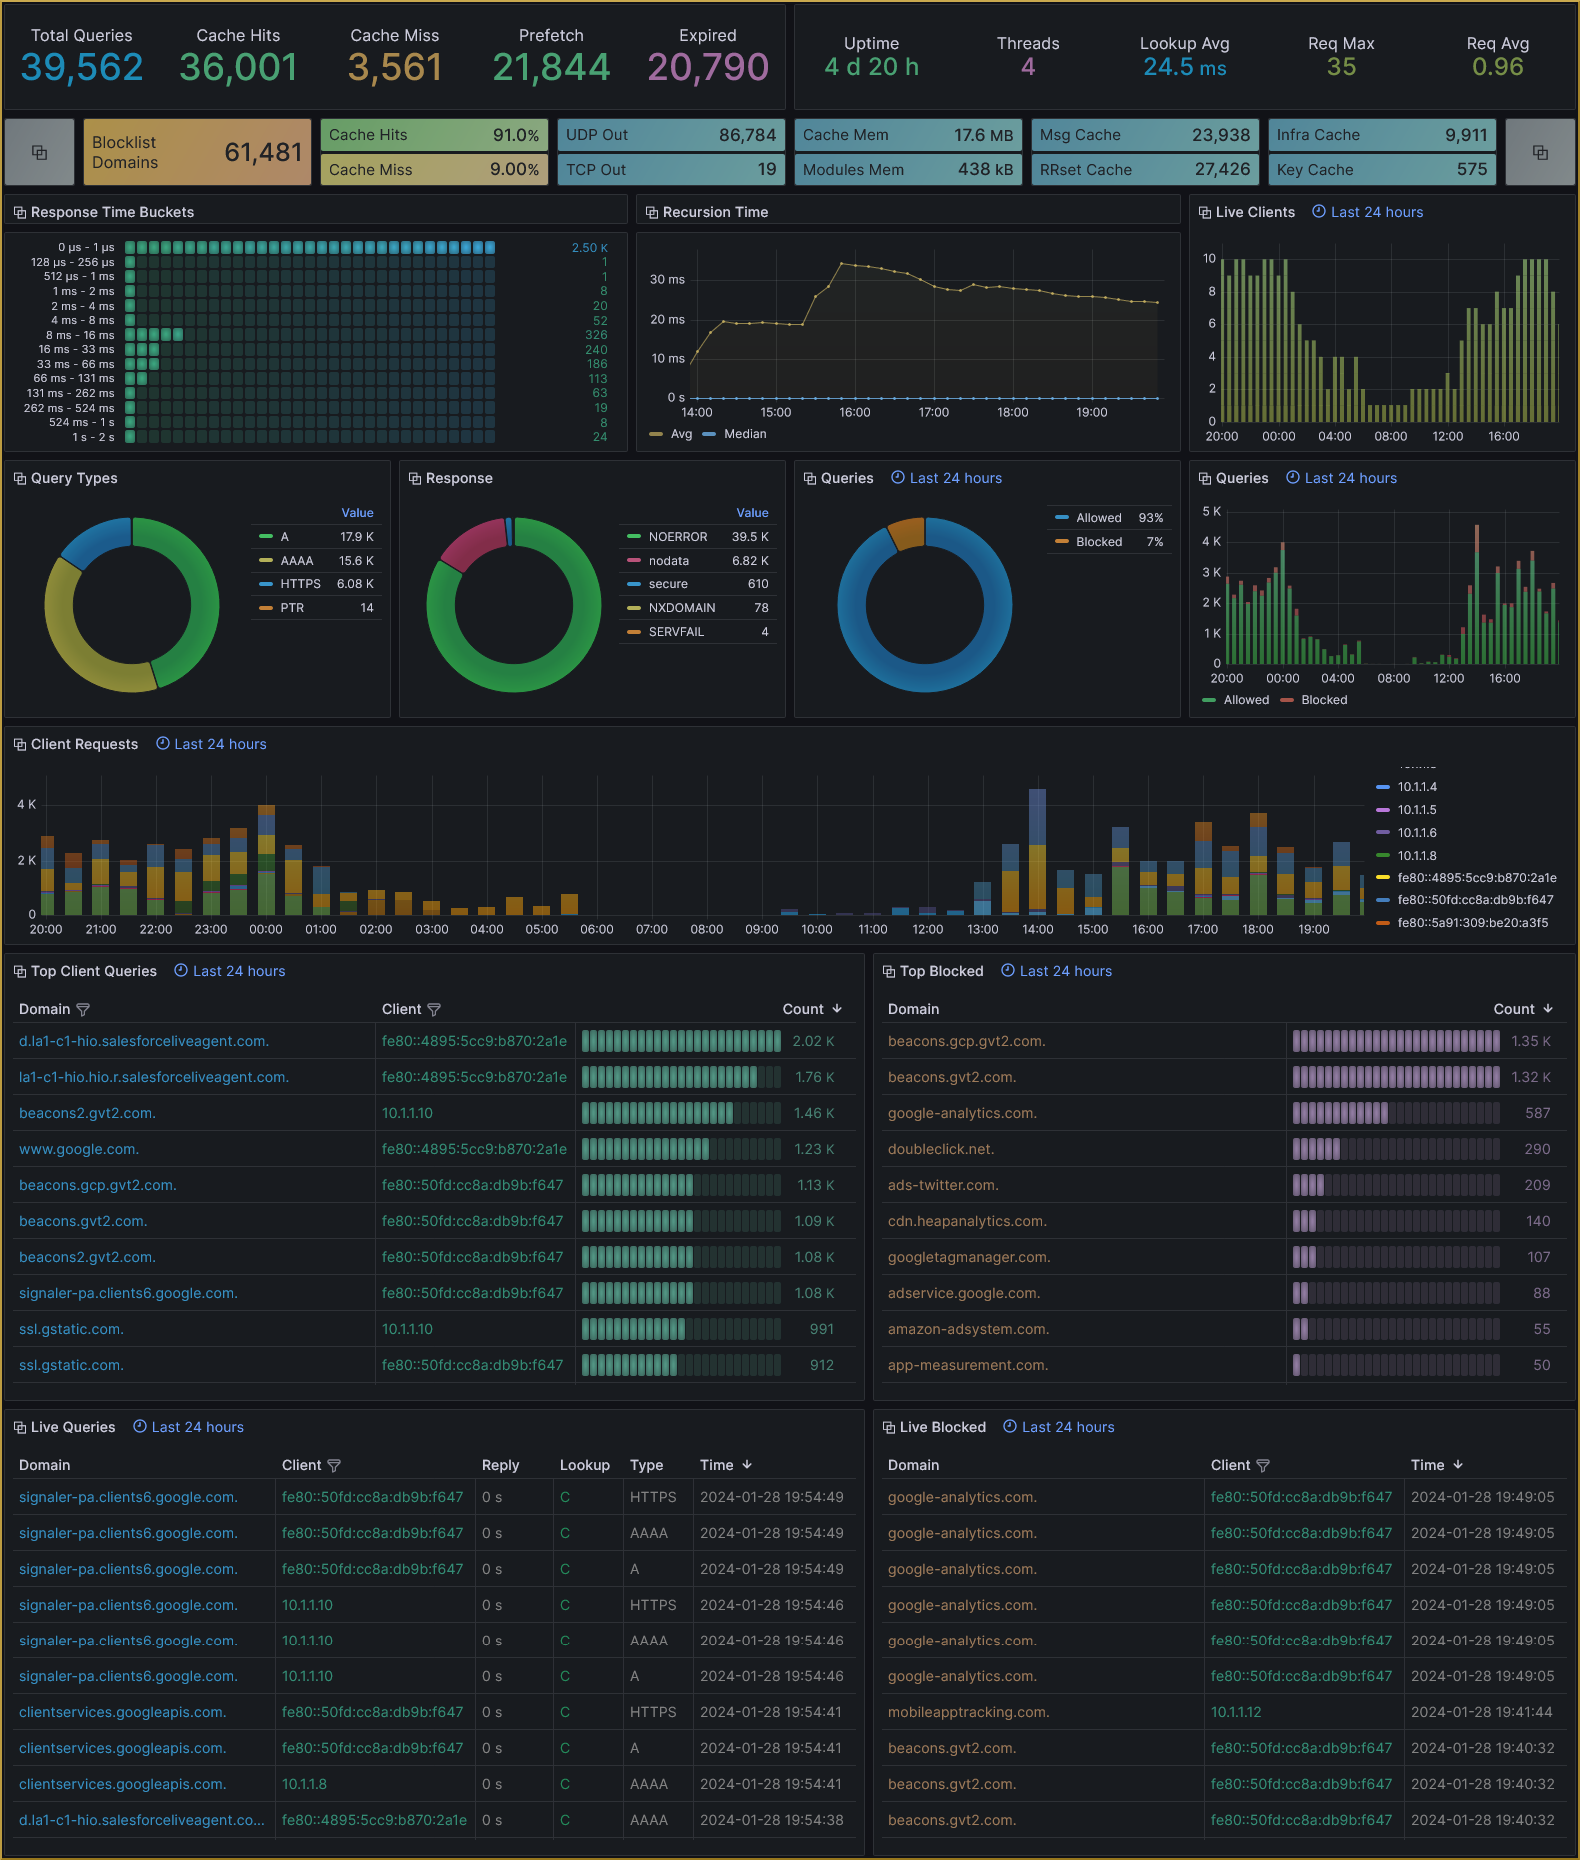
Unbound metrics & logs dashboard using Prometheus and Loki
Dashboard usage:
https://github.com/ar51an/unbound-dashboard
Unbound setup:
https://github.com/ar51an/unbound-redis
Releases:
Revision 6:
Grafana version 10.2.3
Loki version 2.9.3
Used Metrics 3434
unbound_queries_total
unbound_cache_hit_total
unbound_cache_miss_total
unbound_prefetch_total
unbound_expired_total
unbound_time_up_seconds
unbound_request_list_current_user
unbound_recursion_time_avg_seconds
unbound_request_list_max
unbound_request_list_avg
-
up
-
scrape_duration_seconds
unbound_blocklist_domain_count
unbound_query_udpout_count
unbound_query_tcpout_count
unbound_memory_caches_bytes
unbound_memory_modules_bytes
unbound_msg_cache_count
unbound_rrset_cache_count
unbound_infra_cache_count
unbound_key_cache_count
pattern
_
client
unbound_response_time_buckets
unbound_recursion_time_median_seconds
unbound_query_types_count
unbound_answer_rcodes_count
unbound_answer_secure_count
unbound_answer_bogus_count
domain
type
lookup_time
cache