Docker and Host Monitoring w/ Prometheus 40,78240,782 4.0 (2 reviews)
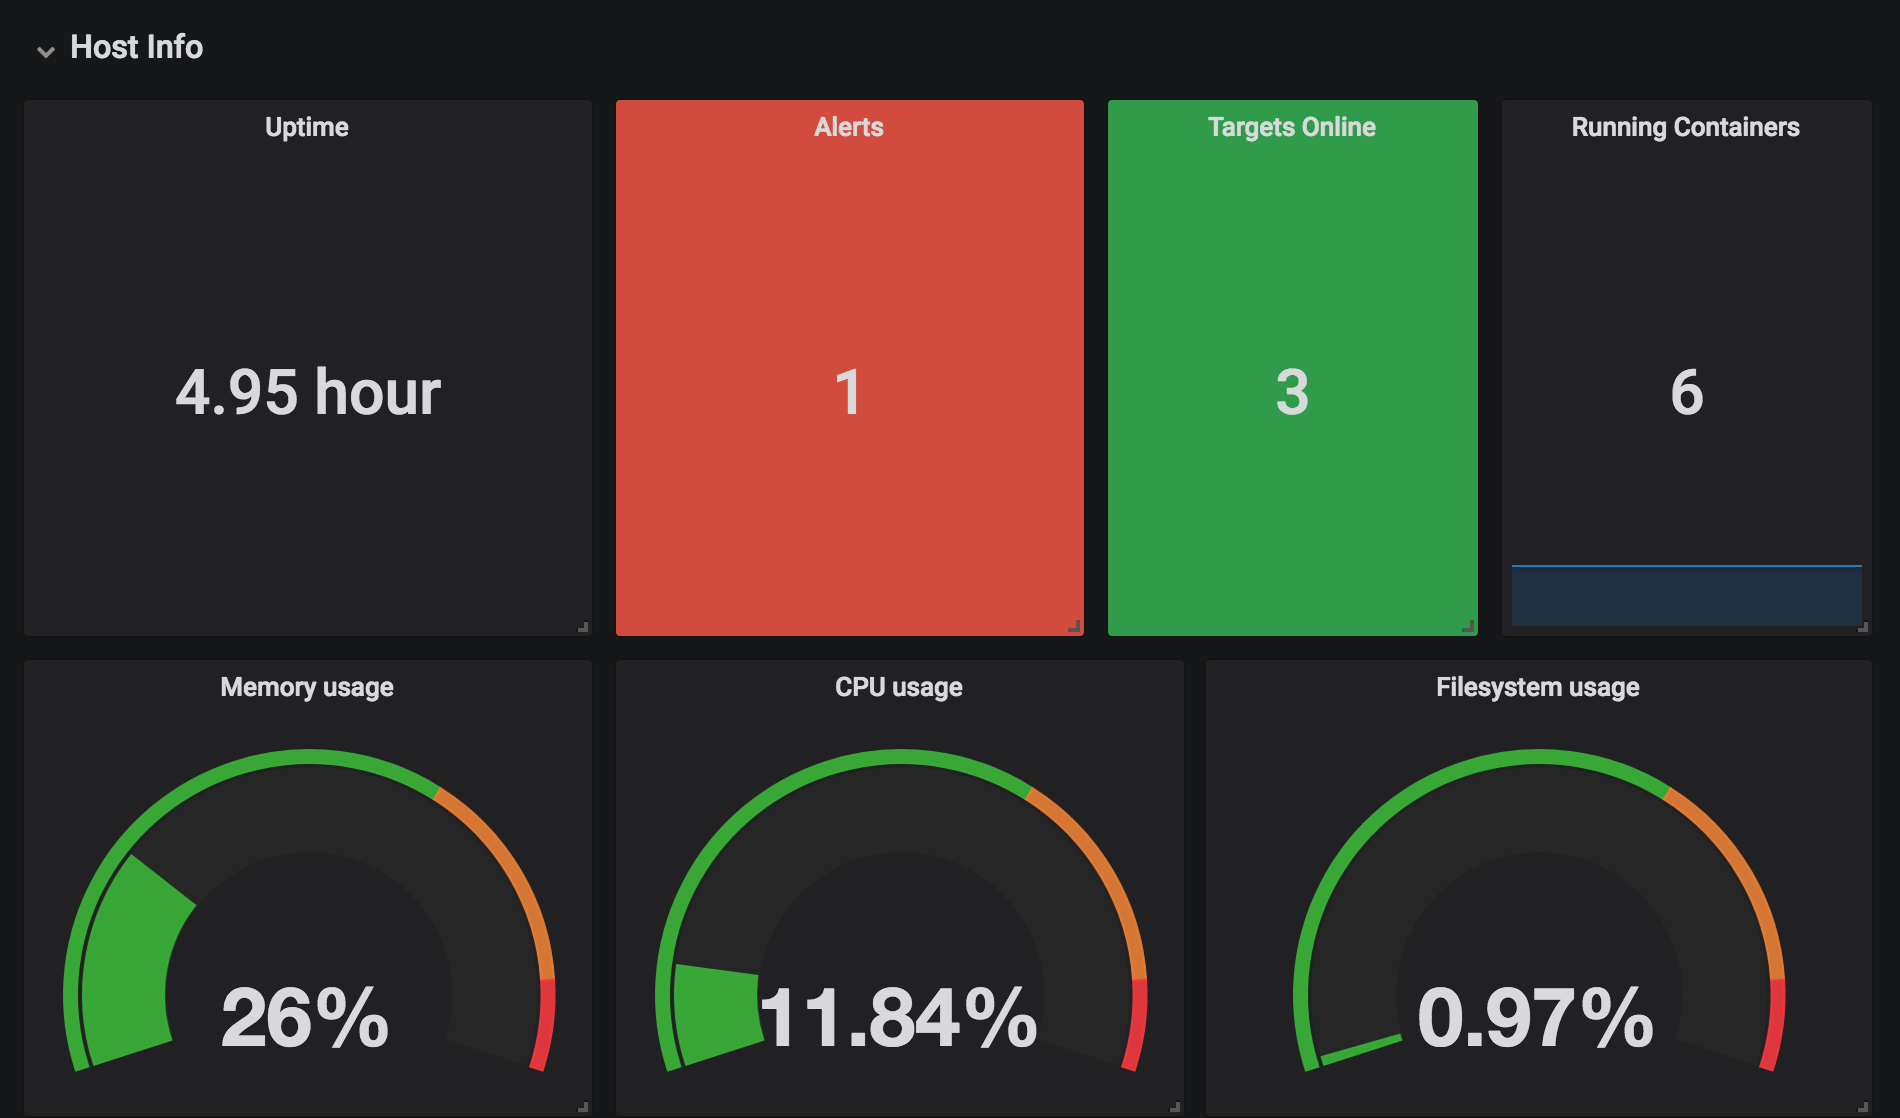
The dashboard is part of the Docker Prometheus Quickstart Project The project uses the latest versions of Prometheus, Grafana, cAdvisor, and node-exporter. Also, included in the project is automated provisioning of datasources & dashboards.
If your have any suggestions or would like to contribute please visit - Docker Prometheus Quick Start Project
Regards,
Brian Christner
Used Metrics 2222
-
process_start_time_seconds
ALERTS
-
up
-
container_last_seen
-
node_memory_MemTotal_bytes
-
node_memory_MemFree_bytes
-
node_memory_Buffers_bytes
-
node_memory_Cached_bytes
-
container_cpu_usage_seconds_total
-
node_cpu_seconds_total
-
container_fs_limit_bytes
-
container_fs_usage_bytes
-
container_network_receive_bytes_total
interval
-
container_network_transmit_bytes_total
-
node_memory_MemAvailable_bytes
-
node_filesystem_free_bytes
container_cpu_load_average_
-
container_memory_max_usage_bytes
-
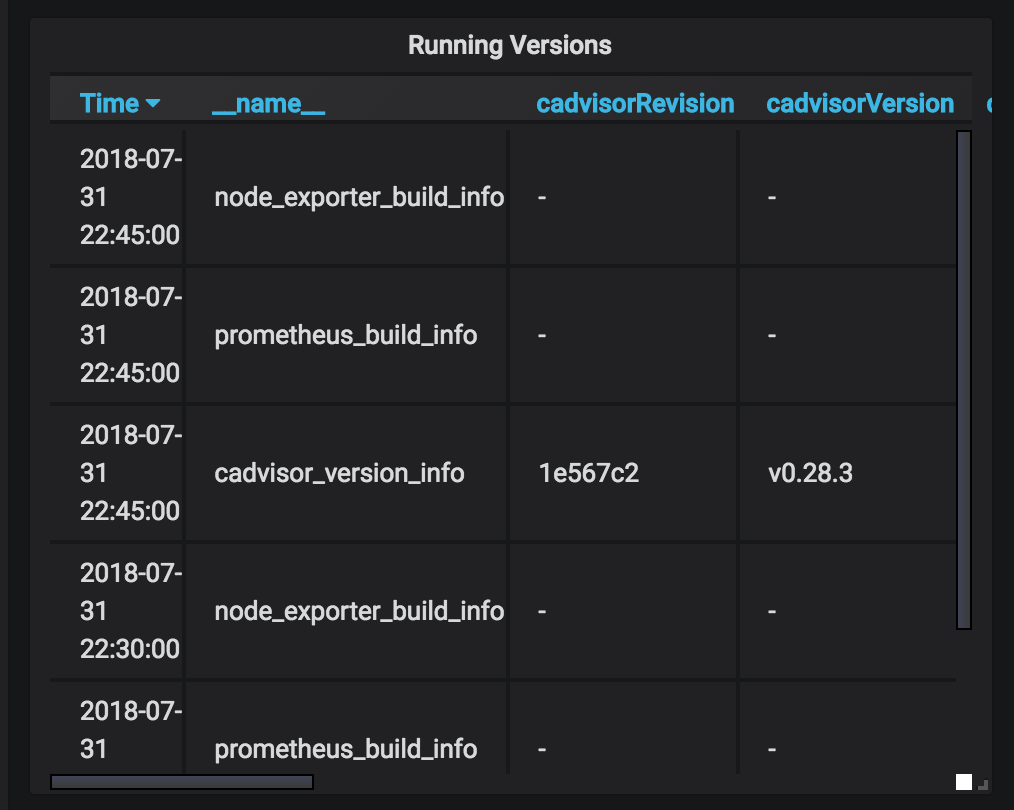
cadvisor_version_info
-
prometheus_build_info
-
node_exporter_build_info