Gitea Dashbaord 1,9251,925
1/4/2023
3/25/2024
3
>=10.4.0
Prometheus
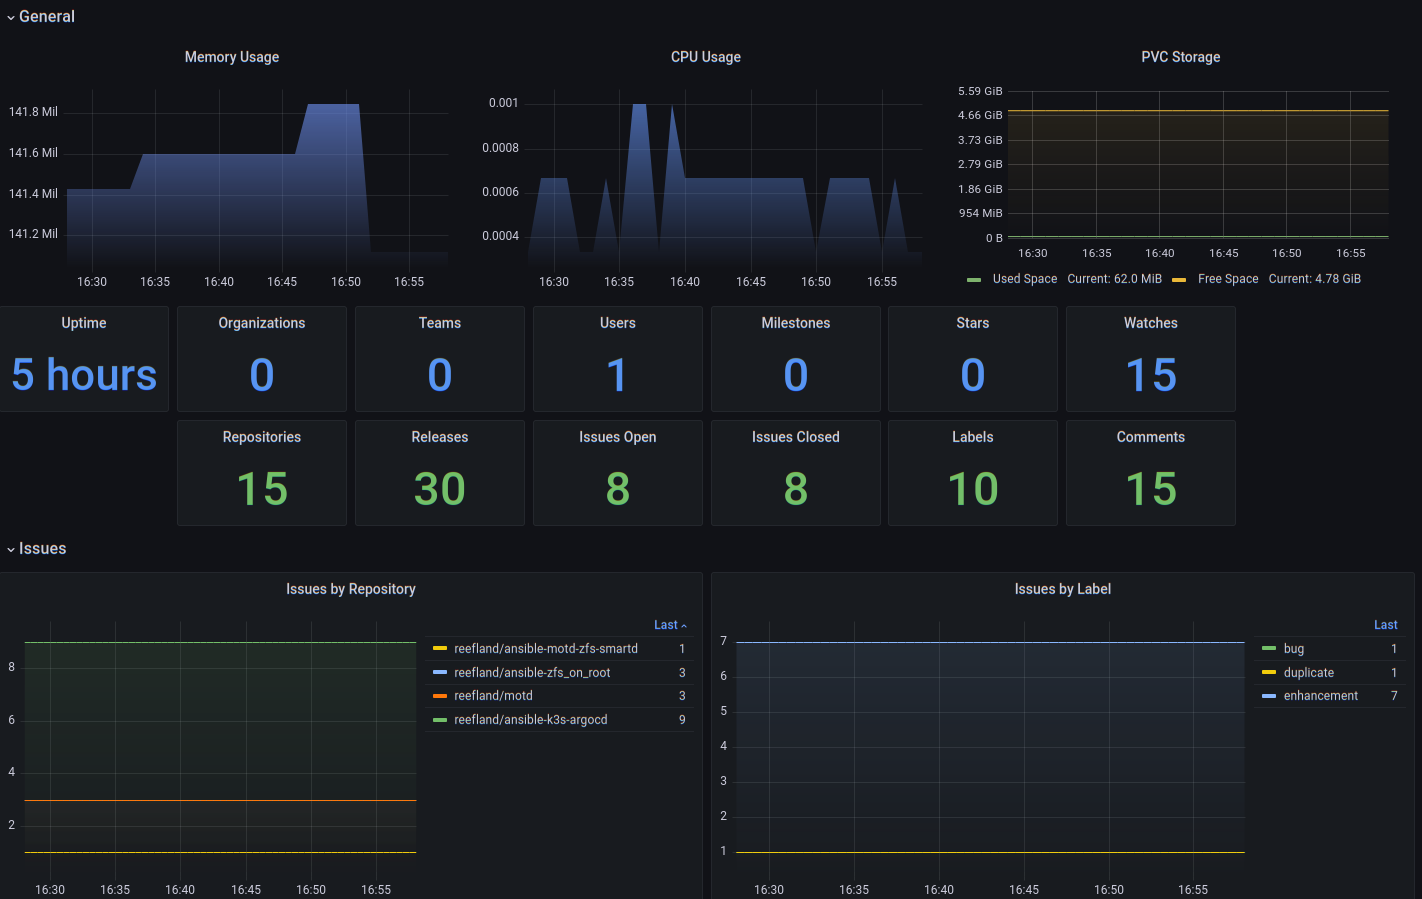
Dashboard to monitor Gitea deployed as a StatefulSet on Kubernetes. Can also monitor Gitea's PVC storage space.
The "app.ini" needs to have at least the following in the metrics section:
[metrics] ENABLED = true ENABLED_ISSUE_BY_REPOSITORY=true ENABLED_ISSUE_BY_LABEL=true
Export Dashboard✕
Download
Copy to Clipboard
Used Metrics 2121
-
process_resident_memory_bytes
-
process_cpu_seconds_total
resolution
topk
kubelet_volume_stats_capacity_bytes
kubelet_volume_stats_available_bytes
-
process_start_time_seconds
gitea_organizations
gitea_teams
gitea_users
gitea_milestones
gitea_stars
gitea_watches
gitea_repositories
gitea_releases
gitea_issues_open
gitea_issues_closed
gitea_labels
gitea_comments
gitea_issues_by_repository
gitea_issues_by_label