Loki Metrics Dashboard 68,09968,099
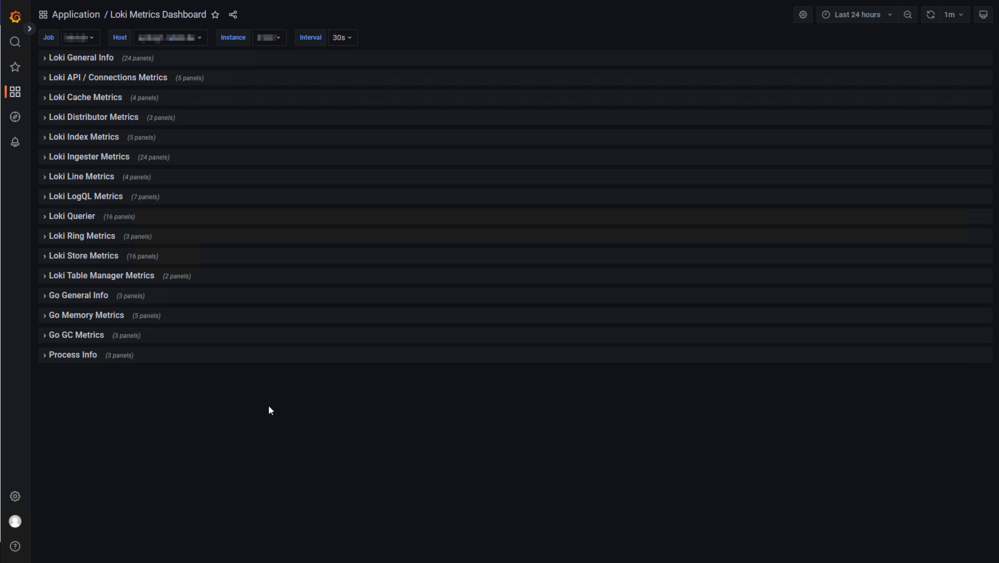
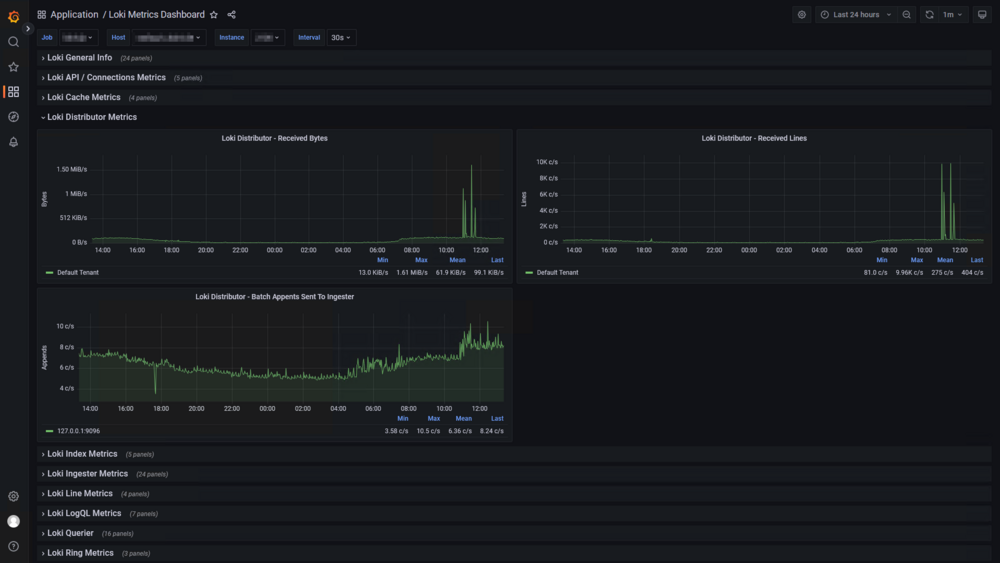
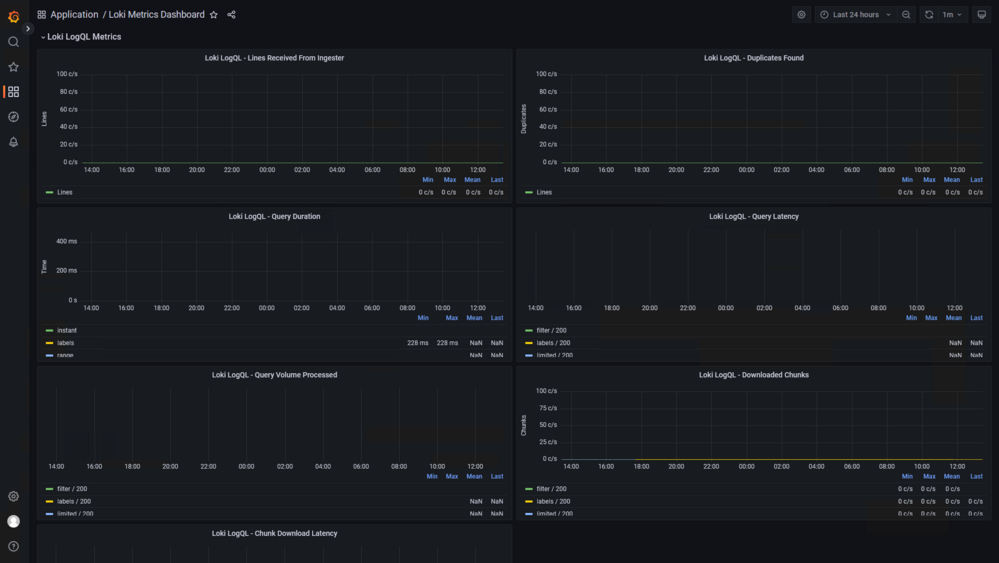
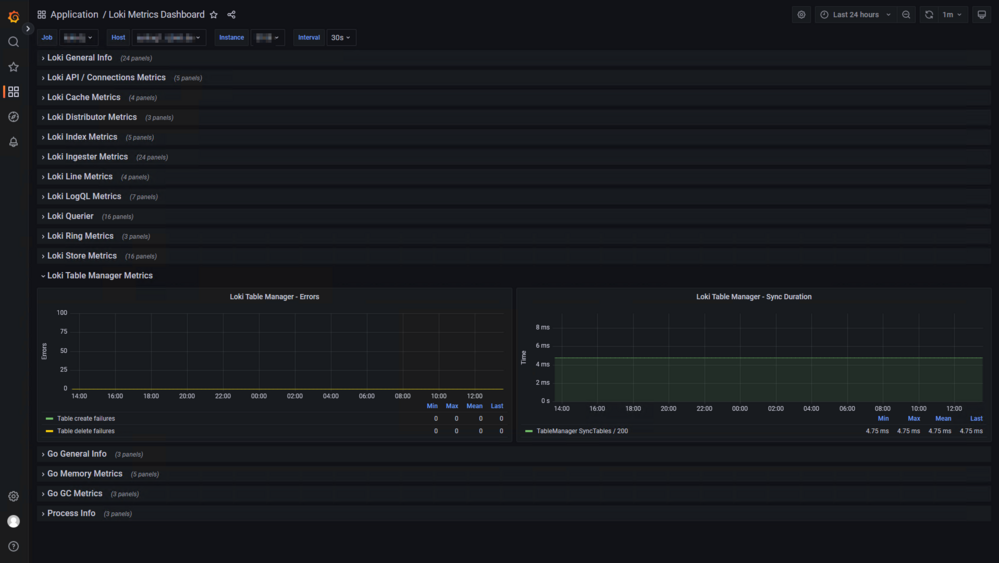
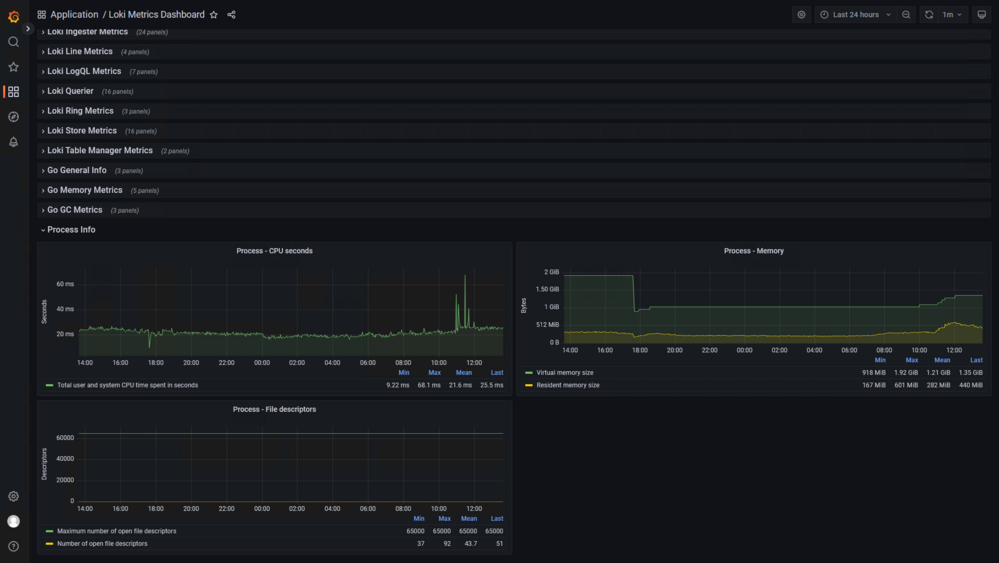
A metrics dashboard for the metrics provided by Grafana Loki.
Metrics are expected to be collected by Prometheus from Loki. Supports multiple Prometheus jobs for querying metrics from multiple Grafana Loki instances.
Where applicable the graphs are able to work with the tenant feature in Grafana Loki.
Initially created with Grafana v9.3.1 and Grafana Loki v2.7.0
Used Metrics 2727
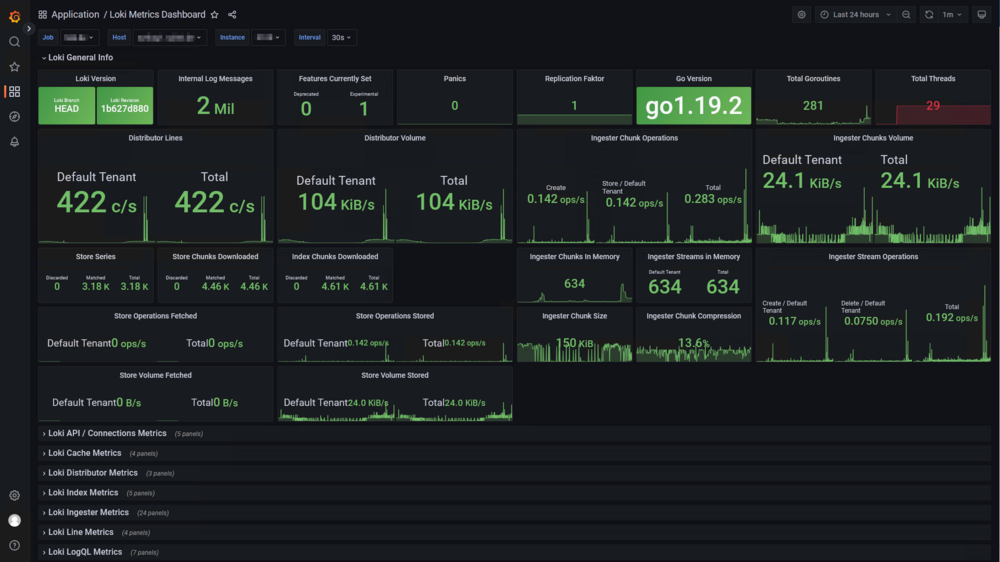
loki_build_info
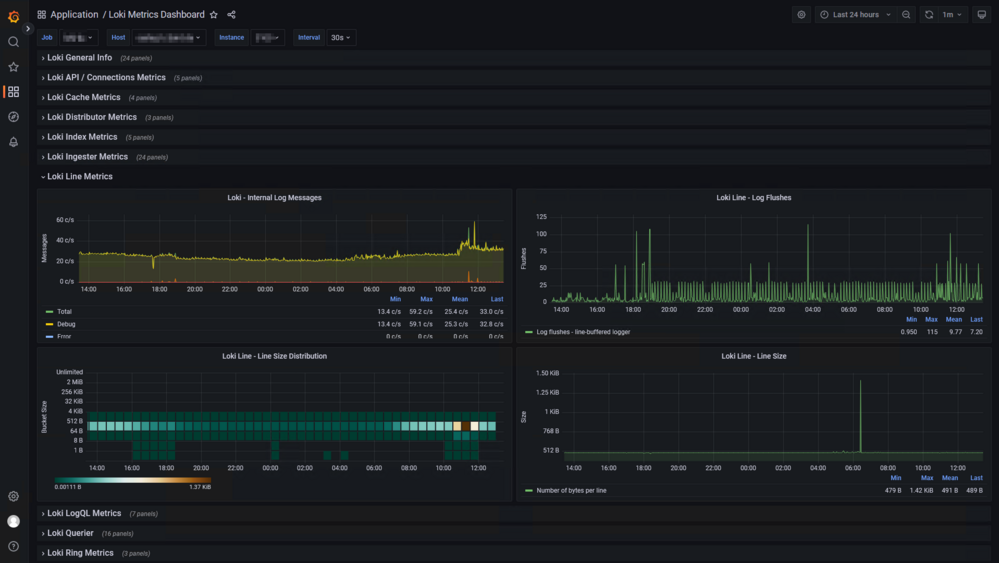
loki_internal_log_messages_total
deprecated_flags_inuse_total
loki_experimental_features_in_use_total
loki_panic_total
loki_distributor_replication_factor
-
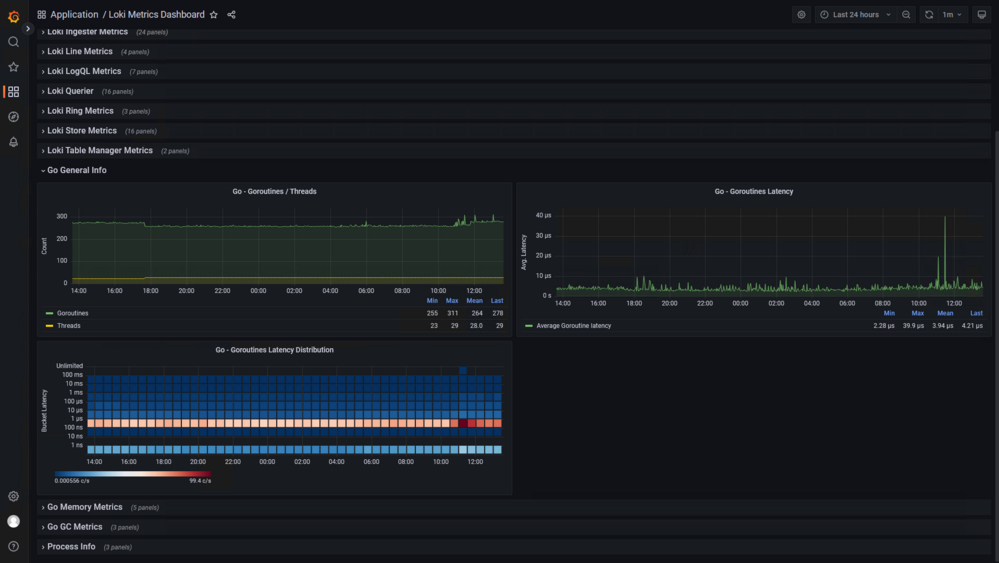
go_info
-
go_goroutines
-
go_threads
loki_distributor_lines_received_total
loki_distributor_bytes_received_total
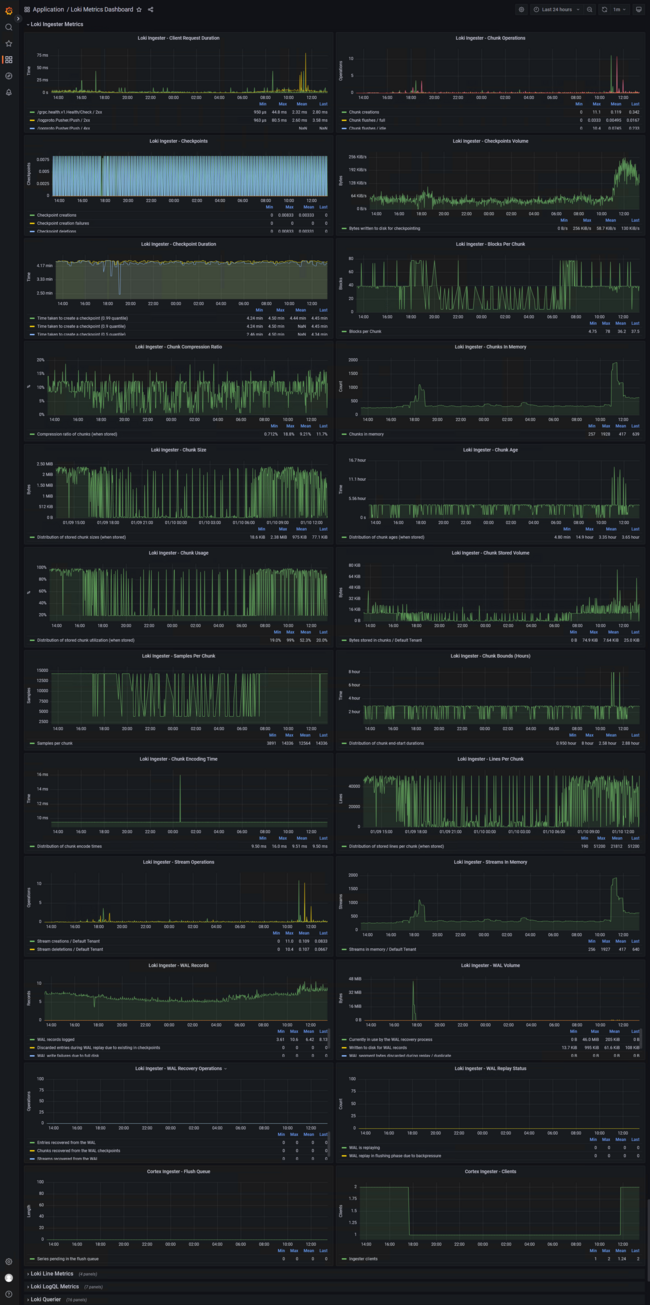
loki_ingester_chunks_created_total
loki_ingester_chunks_stored_total
loki_ingester_chunk_stored_bytes_total
loki_store_series_total
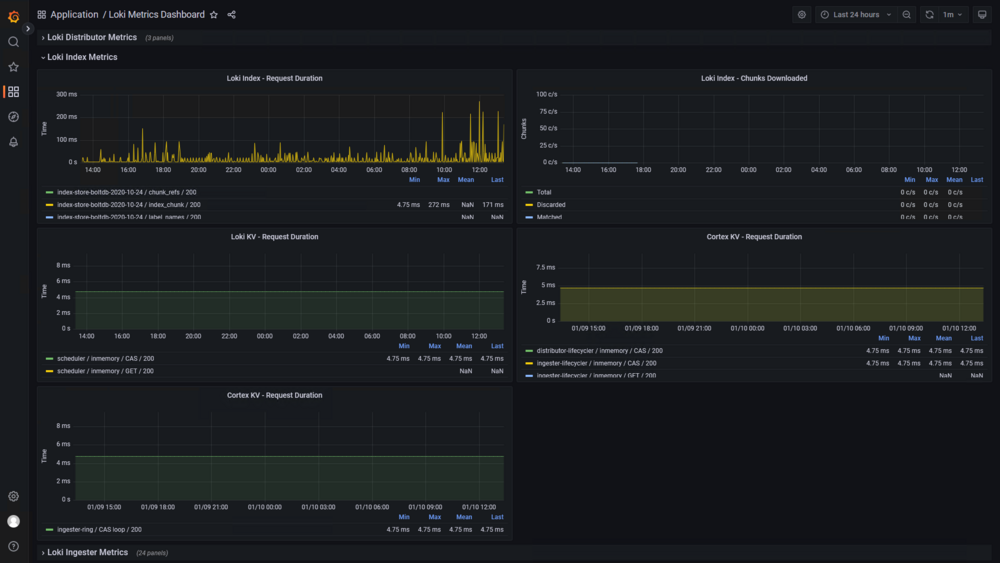
loki_store_chunks_downloaded_total
loki_index_chunk_refs_total
loki_ingester_memory_chunks
loki_ingester_memory_streams
loki_ingester_streams_created_total
loki_ingester_streams_removed_total
loki_chunk_store_fetched_chunks_total
loki_chunk_store_stored_chunks_total
loki_ingester_chunk_size_bytes_bucket
loki_ingester_chunk_compression_ratio_bucket
loki_chunk_store_fetched_chunk_bytes_total
loki_chunk_store_stored_chunk_bytes_total