EMQX 11,25211,252 5.0 (1 reviews)
Introduction
EMQX is the most scalable and popular open-source MQTT broker with a high performance that connects 100M+ IoT devices in 1 cluster at 1ms latency. Move and process millions of MQTT messages per second.
The EMQX v5.0 has been verified in test scenarios to scale to 100 million concurrent device connections, which is a critically important milestone for IoT designers. It also comes with plenty of exciting new features and huge performance improvements, including a more powerful rule engine, enhanced security management, Mria database extension, and much more to enhance the scalability of IoT applications.
During the last several years, EMQX has gained popularity among IoT companies and is used by more than 20,000 global users from over 50 countries, with more than 100 million IoT device connections supported worldwide.
For more information, please visit EMQX homepage.
Get Started
EMQX Cloud
The simplest way to set up EMQX is to create a managed deployment with EMQX Cloud. You can try EMQX Cloud for free, no credit card required.
Run EMQX using Docker
docker run -d --name emqx -p 1883:1883 -p 8083:8083 -p 8084:8084 -p 8883:8883 -p 18083:18083 emqx/emqx:latest
Next, follow the getting started guide to tour the EMQX features.
Run EMQX cluster on Kubernetes
For details: EMQX Operator.
More installation options
If you prefer to install and manage EMQX, you can download the latest version from www.emqx.io/downloads.
For more installation options, see the EMQX installation documentation.
Metrics Displayed
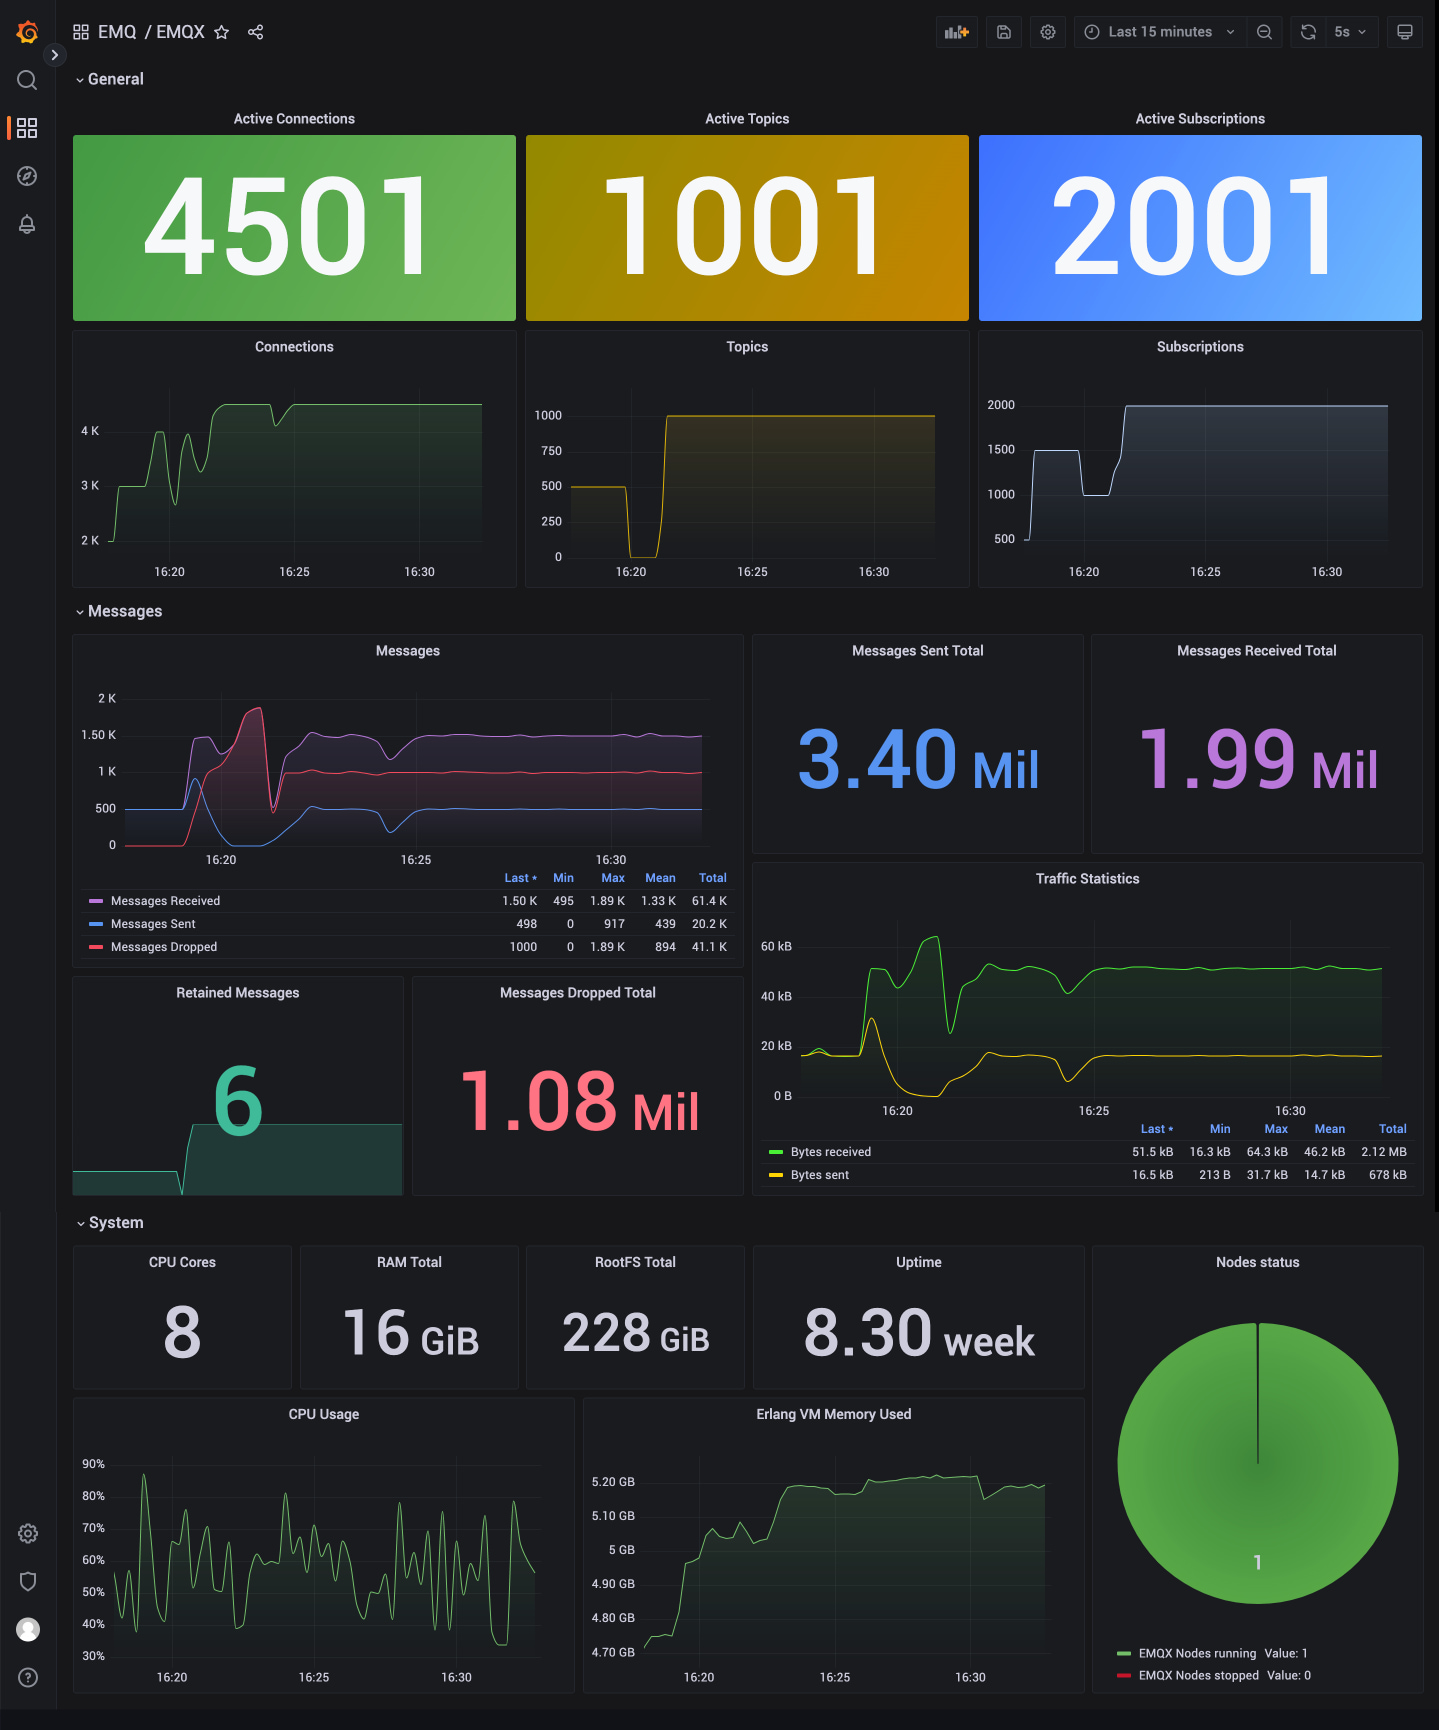
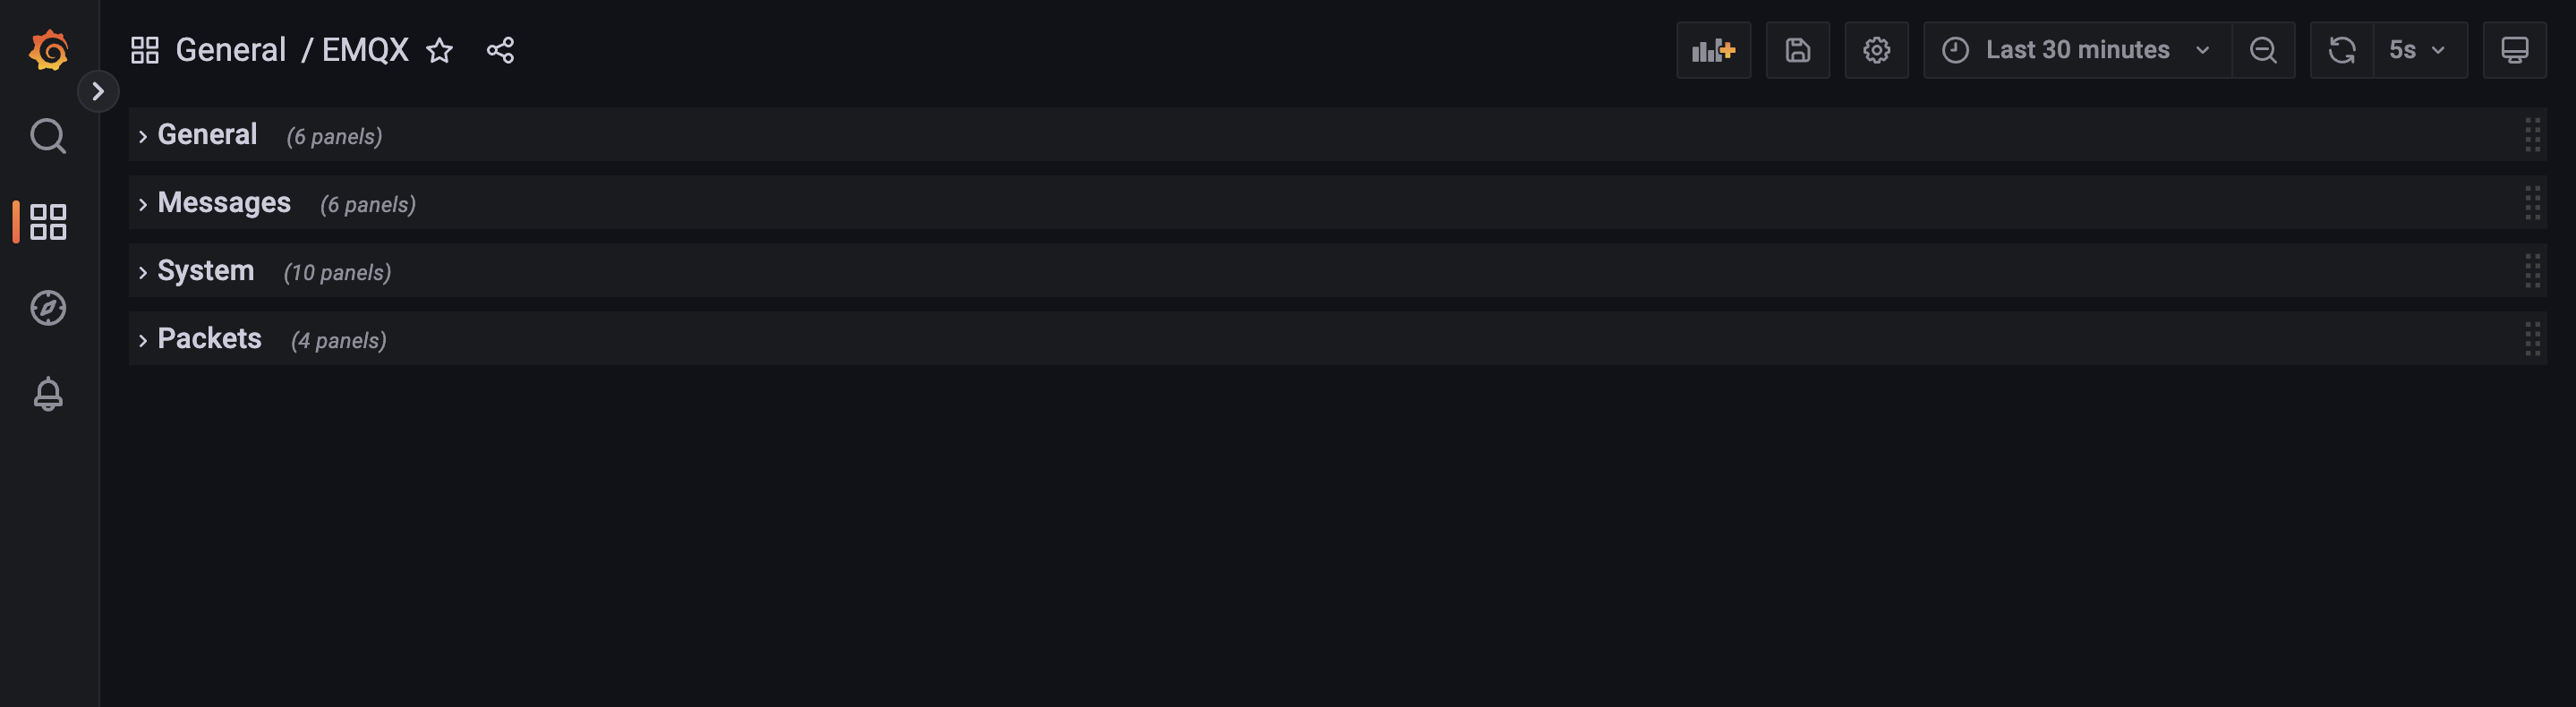
After you install EMQX, you can view the basic metrics or custom the metrics and display them in the Grafana dashboard. Below are the metrics displayed in the dashboard.
- General, including the number of connections, topics, and subscriptions.
- Messages, including the number of messages published and received and the number of messages published and received per second.
- System, including the number of processes, CPU and Erlang VM memory, etc.
- Packet, including the number of packets connected, published, received, etc.
Note: This Dashboard template is available for EMQX 5.0
Used Metrics 3636
emqx_connections_count
emqx_topics_count
emqx_suboptions_count
emqx_messages_received
emqx_messages_sent
emqx_messages_dropped
emqx_bytes_received
emqx_bytes_sent
emqx_retained_count
-
node_cpu_seconds_total
node_memory_total_bytes
-
node_filesystem_size_bytes
-
node_time_seconds
-
node_boot_time_seconds
emqx_cluster_nodes_running
emqx_cluster_nodes_stopped
emqx_vm_used_memory
erlang_mnesia_memory_usage_bytes
erlang_vm_process_count
erlang_vm_statistics_run_queues_length_total
erlang_vm_threads
erlang_vm_thread_pool_size
emqx_packets_connect
emqx_packets_connack_sent
emqx_packets_connack_error
emqx_packets_disconnect_sent
emqx_packets_disconnect_received
emqx_packets_publish_sent
emqx_packets_publish_received
emqx_packets_publish_dropped
emqx_packets_publish_error
emqx_packets_subscribe_received
emqx_packets_suback_sent
emqx_packets_subscribe_error
emqx_packets_unsubscribe_received
emqx_packets_unsubscribe_error