prometheus-net process metrics 928928
Visualizes the default .NET process metrics exported by prometheus-net
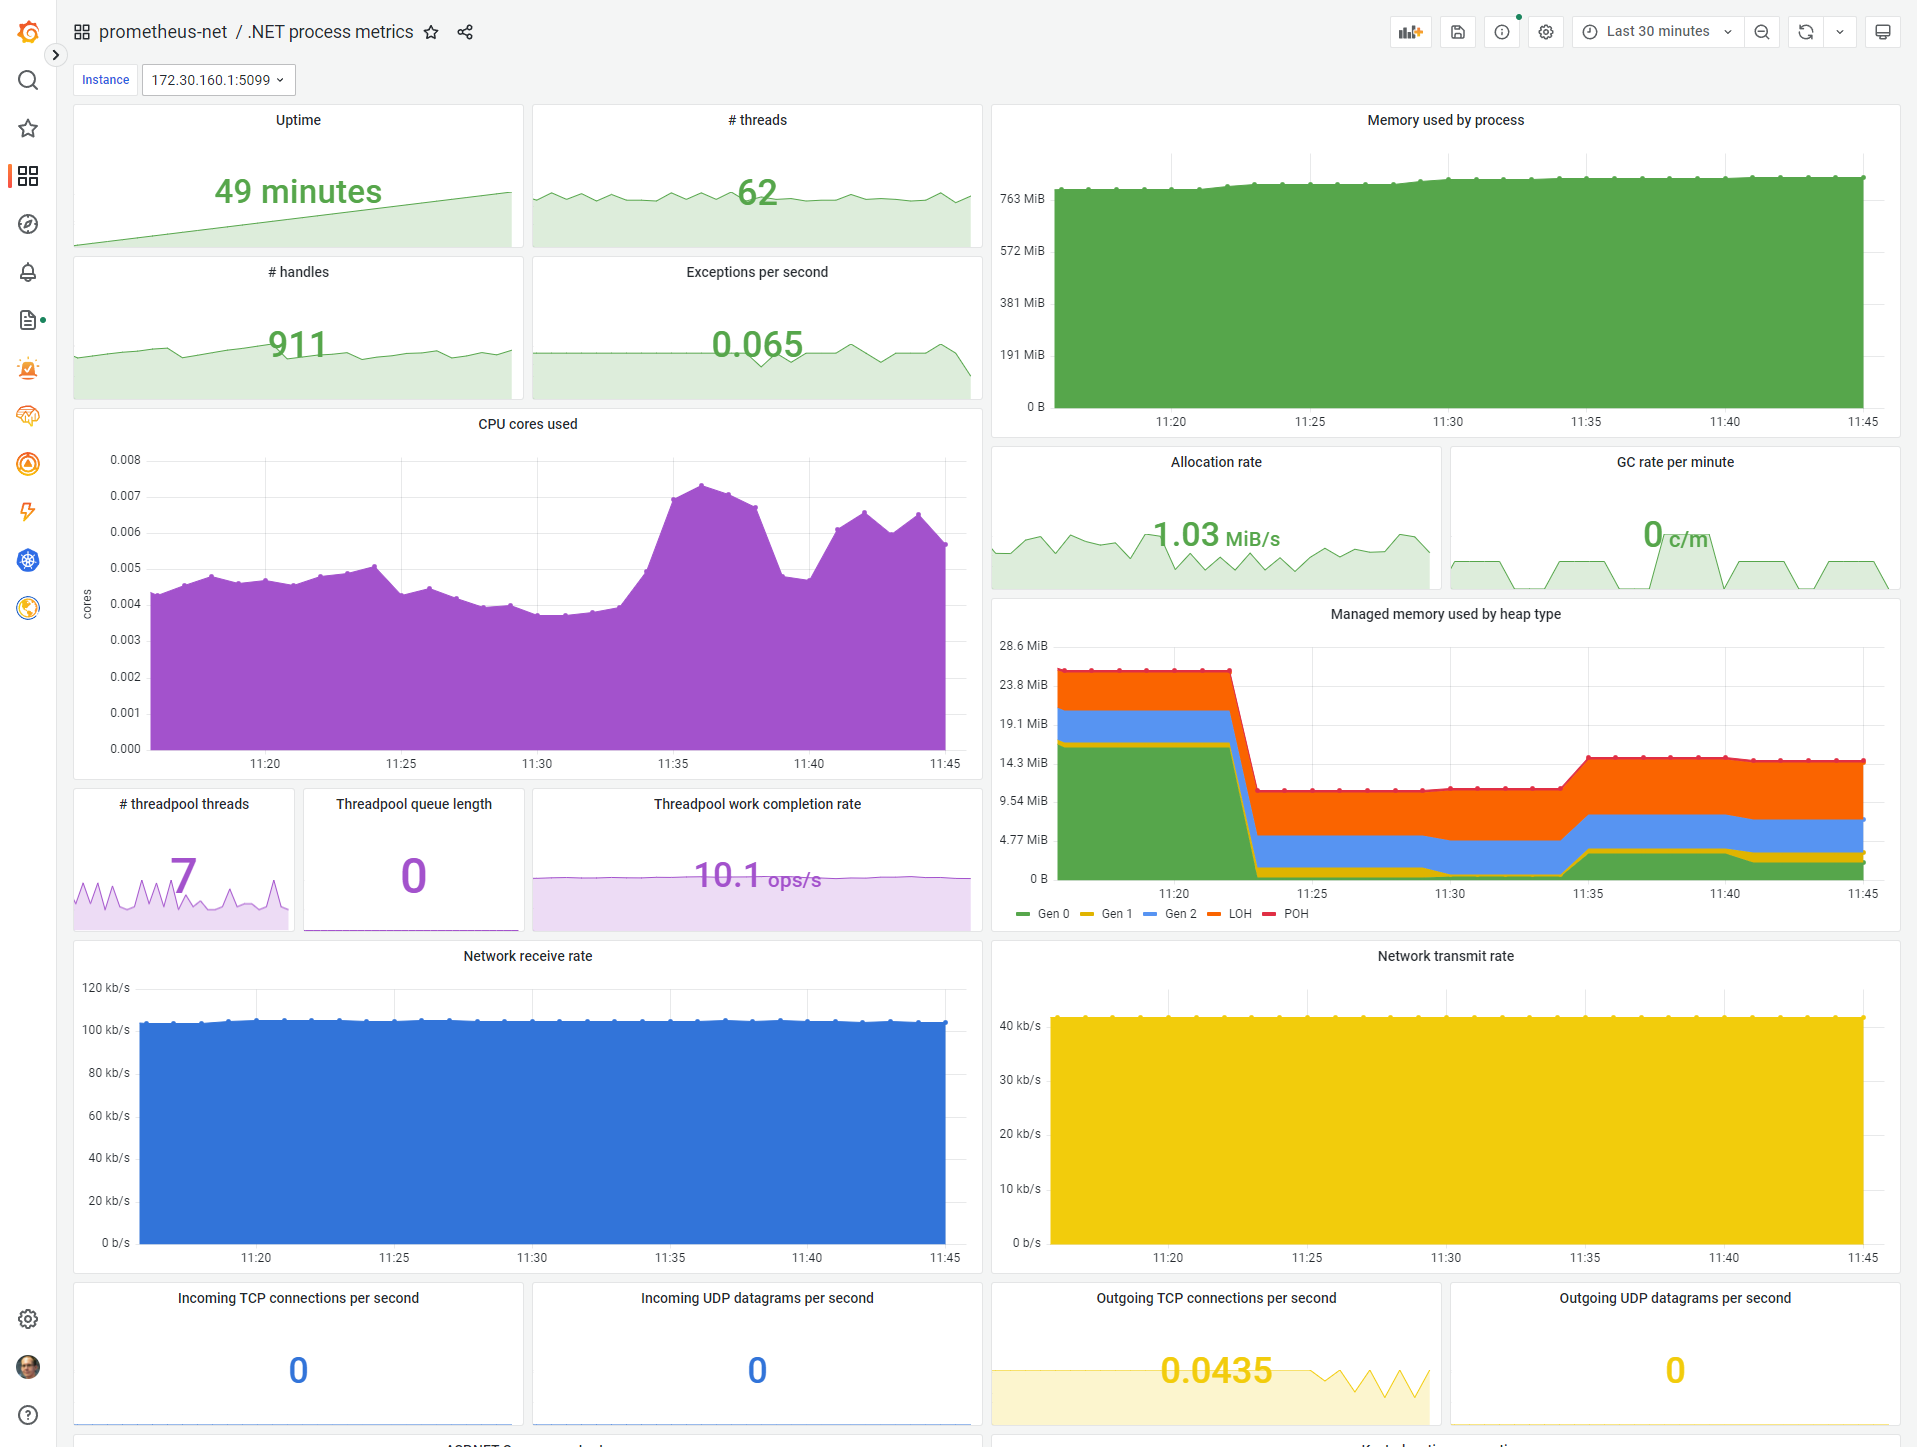
Used Metrics 2828
-
process_start_time_seconds
process_num_threads
system_runtime_gc_heap_size
system_runtime_gc_committed
process_working_set_bytes
process_open_handles
system_runtime_exception_count_total
-
process_cpu_seconds_total
system_runtime_alloc_total
system_runtime_gen_0_gc_count_total
system_runtime_gen_1_gc_count_total
system_runtime_gen_2_gc_count_total
system_runtime_gen_0_size
system_runtime_gen_1_size
system_runtime_gen_2_size
system_runtime_loh_size
system_runtime_poh_size
system_runtime_threadpool_thread_count
system_runtime_threadpool_queue_length
system_runtime_threadpool_completed_items_count_total
system_net_sockets_bytes_received
system_net_sockets_bytes_sent
system_net_sockets_incoming_connections_established
system_net_sockets_datagrams_received
system_net_sockets_outgoing_connections_established
system_net_sockets_datagrams_sent
microsoft_aspnetcore_hosting_total_requests
microsoft_aspnetcore_server_kestrel_current_connections