Opstree/Postgresql Dashboard 1,2691,269
Exporters we are using
- Node Exporter
- PostgreSQL Exporter
Metrics List
Postgresql
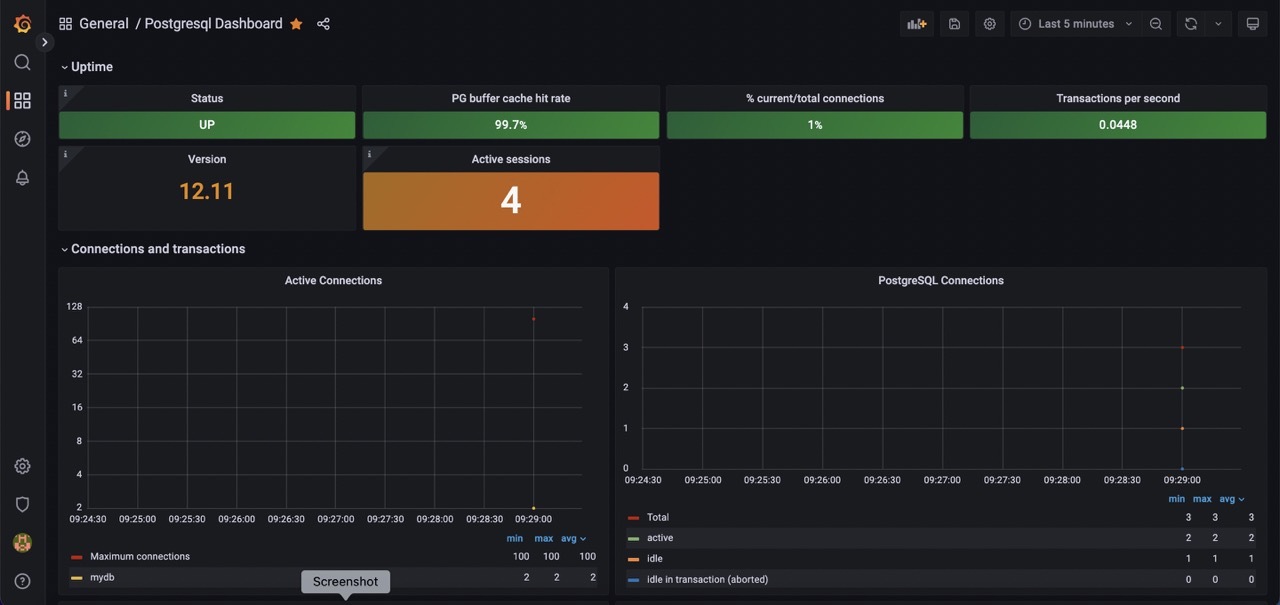
Status
PG buffer cache hit rate in %
Total/current connections in %
Transaction per second
Version
Active session
Active connection
Postgresql COnnections
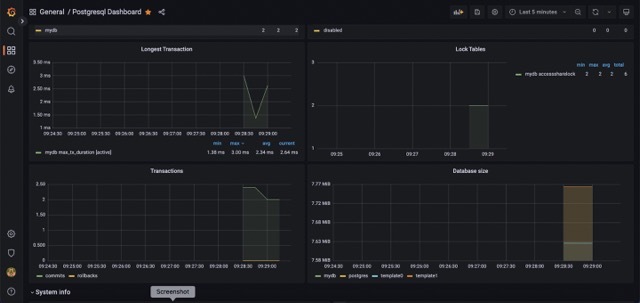
Longest Transaction
Lock Tables
Transactions-Commit and rollback
Database size
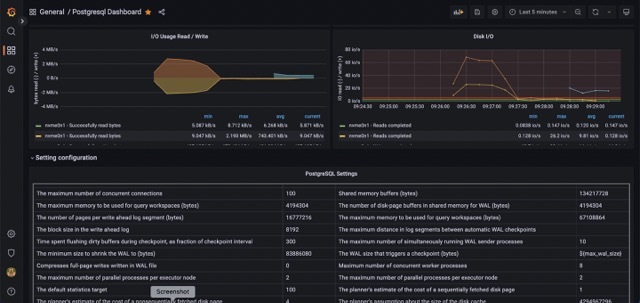
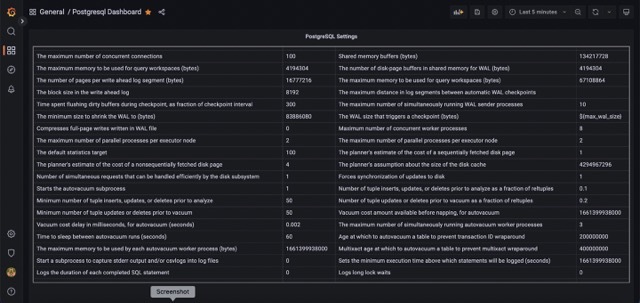
PostgreSQL Settings info
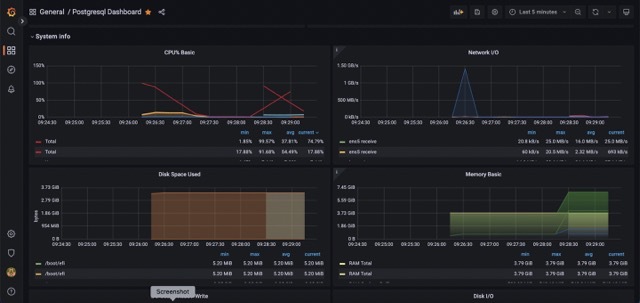
Systeminfo
CPU
Memory
Disk Space
Disk I/O
Used Metrics 2828
-
pg_up
-
pg_stat_database_blks_hit
-
pg_stat_database_blks_read
-
pg_stat_activity_count
-
pg_settings_max_connections
-
pg_stat_database_xact_rollback
-
pg_stat_database_xact_commit
-
pg_stat_database_numbackends
interval
-
pg_stat_activity_max_tx_duration
-
pg_locks_count
topk
pg_database_size_bytes
-
node_cpu_seconds_total
-
node_network_receive_bytes_total
-
node_network_transmit_bytes_total
-
node_filesystem_size_bytes
-
node_filesystem_avail_bytes
-
node_memory_MemTotal_bytes
-
node_memory_MemFree_bytes
-
node_memory_Cached_bytes
-
node_memory_Buffers_bytes
-
node_memory_SwapTotal_bytes
-
node_memory_SwapFree_bytes
-
node_disk_read_bytes_total
-
node_disk_written_bytes_total
-
node_disk_reads_completed_total
-
node_disk_writes_completed_total