HTTP Server Overview 941941
8/25/2022
8/25/2022
1
Web Servers
>=9.0.7
Prometheus
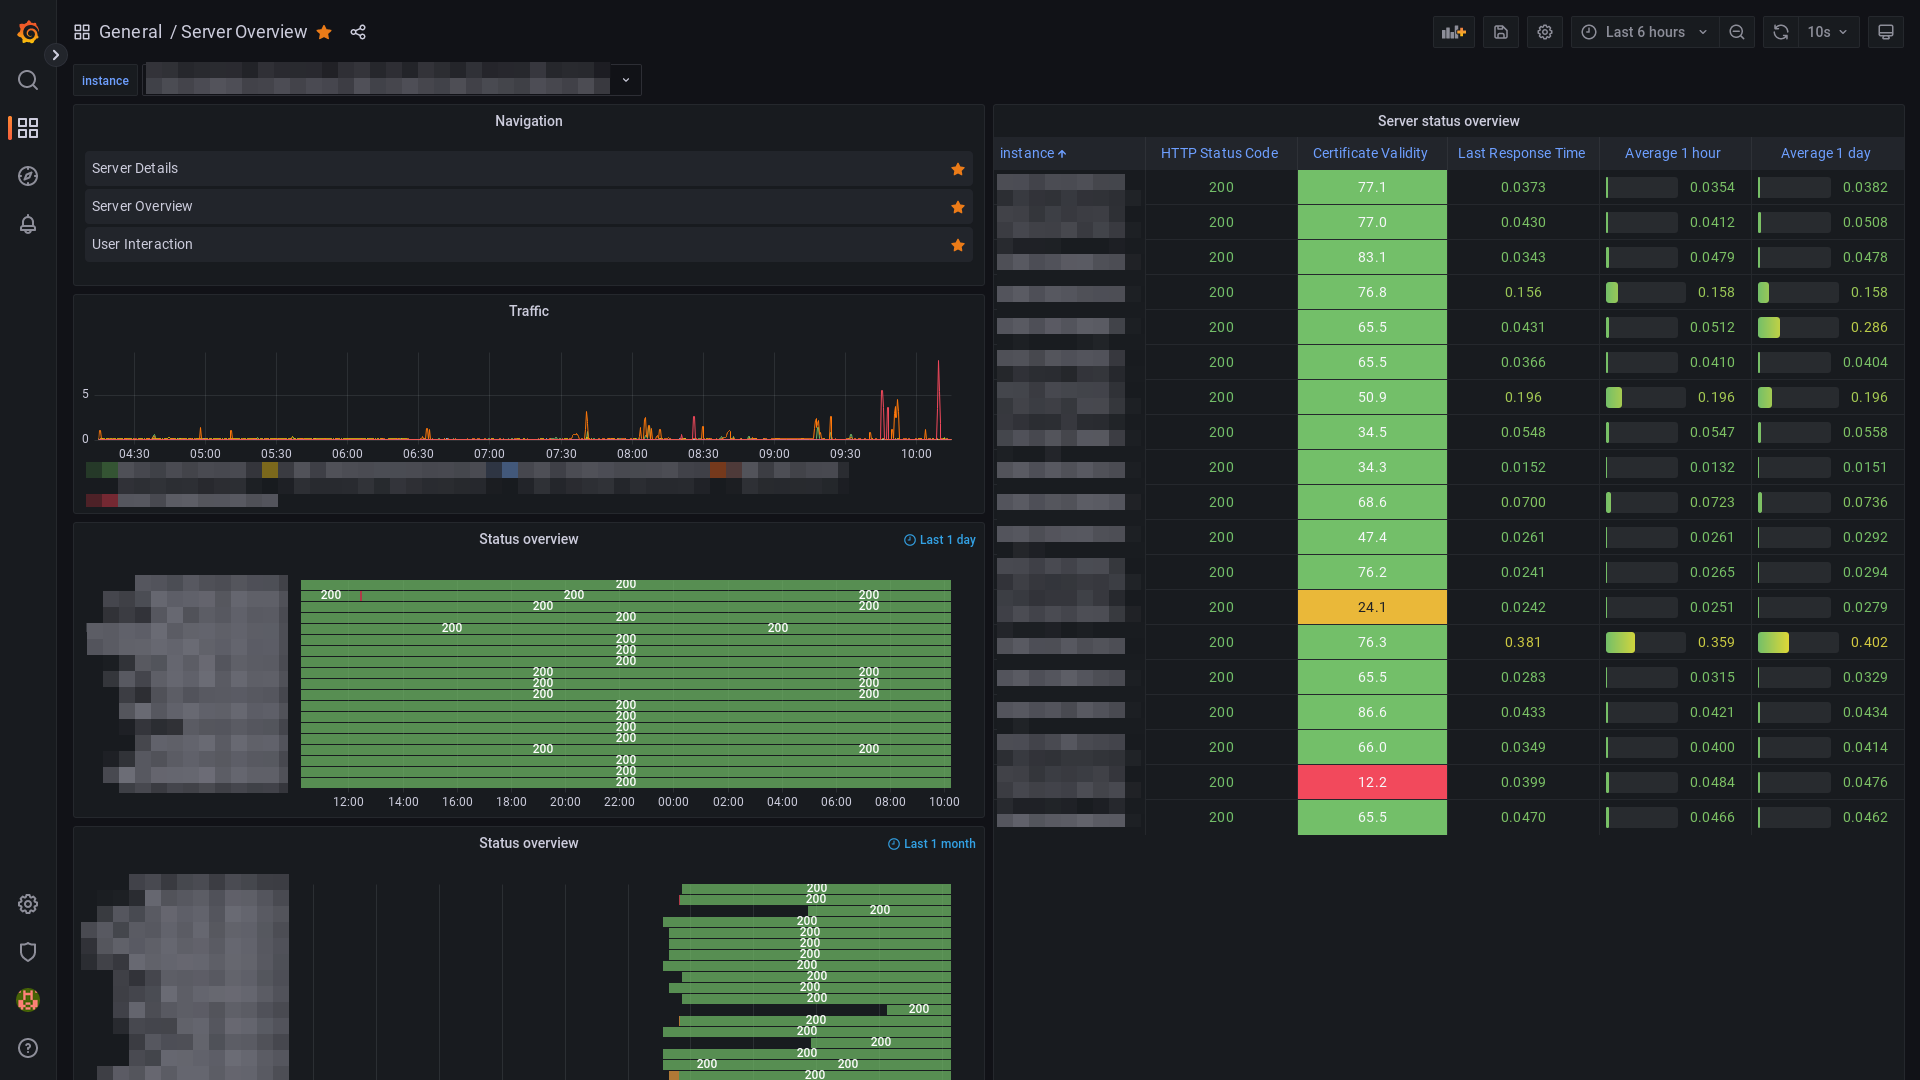
This dashboard uses metrics from two Prometheus modules: Blackbox Exporter and Structr Prometheus Endpoint. See https://structr.com for more information about Structr.
Export Dashboard✕
Download
Copy to Clipboard
Used Metrics 44
-
probe_http_status_code
-
probe_ssl_earliest_cert_expiry
-
probe_duration_seconds
structr_http_requests_total