Kubernetes Cluster for RAM and CPU Utilization 13,03013,030
8/18/2022
8/18/2022
2
>=9.0.5
Prometheus
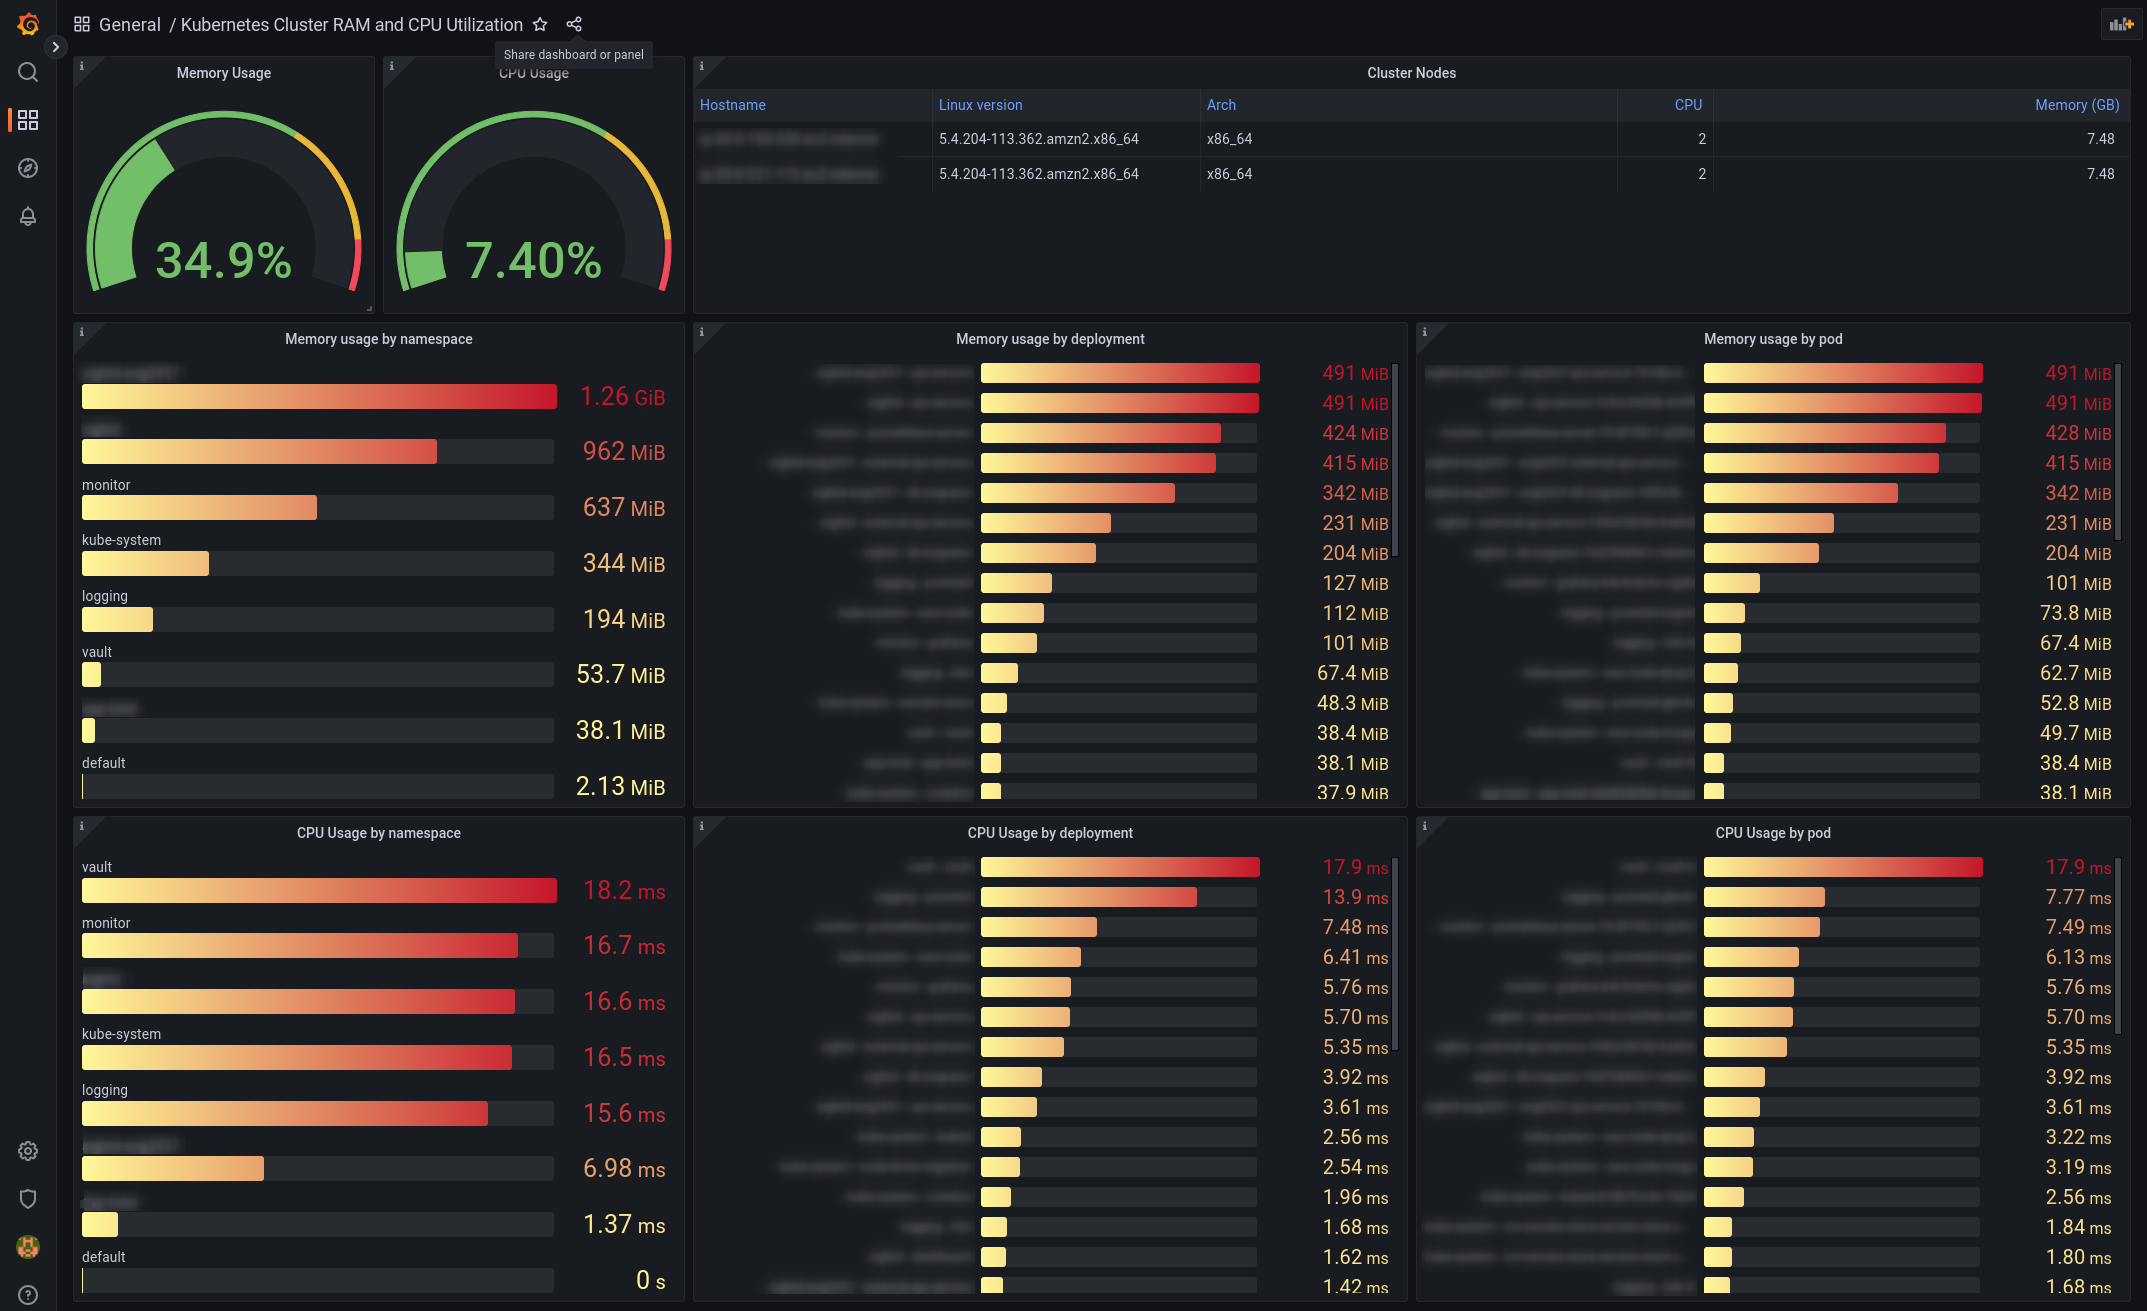
This dashboard shows the utilization, RAM and CPU, of a cluster at a specific point in time.
It helps to answer those questions quickly:
- Is my cluster running out of RAM or CPU?
- If so, what are the problematic namespaces, deployments and pods?
This dashboard uses the default metrics from the Prometheus Helm chart. It needs both Kubelet and Node Exporter metrics.
Export Dashboard✕
Download
Copy to Clipboard