Opstree/Elasticsearch Dashboard 1,8451,845 5.0 (1 reviews)
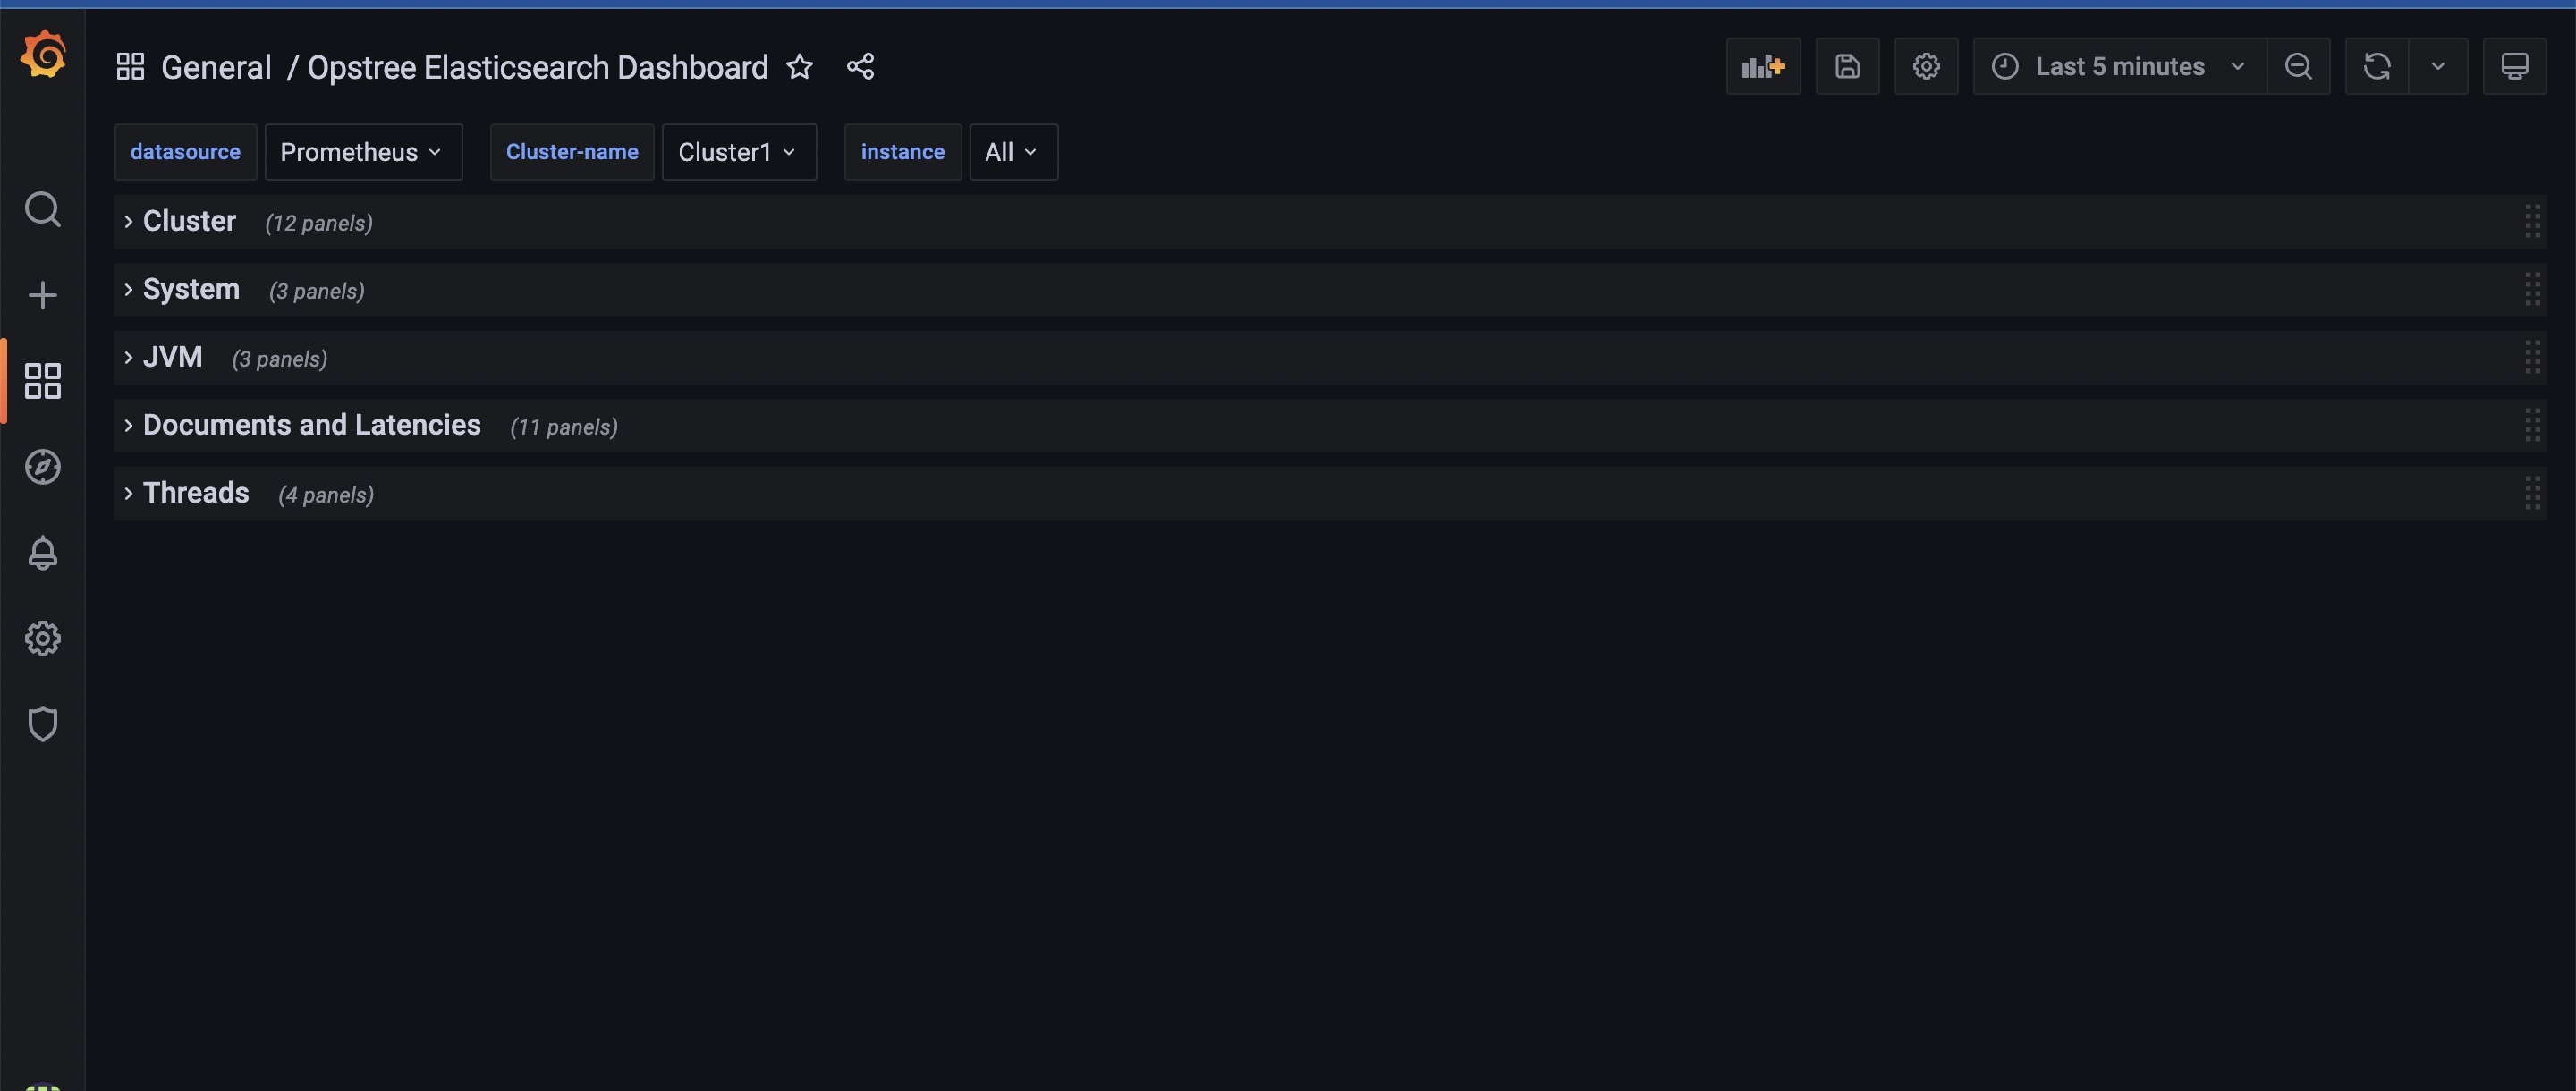
Elasticsearch Cluster Dashboard
Metrics List
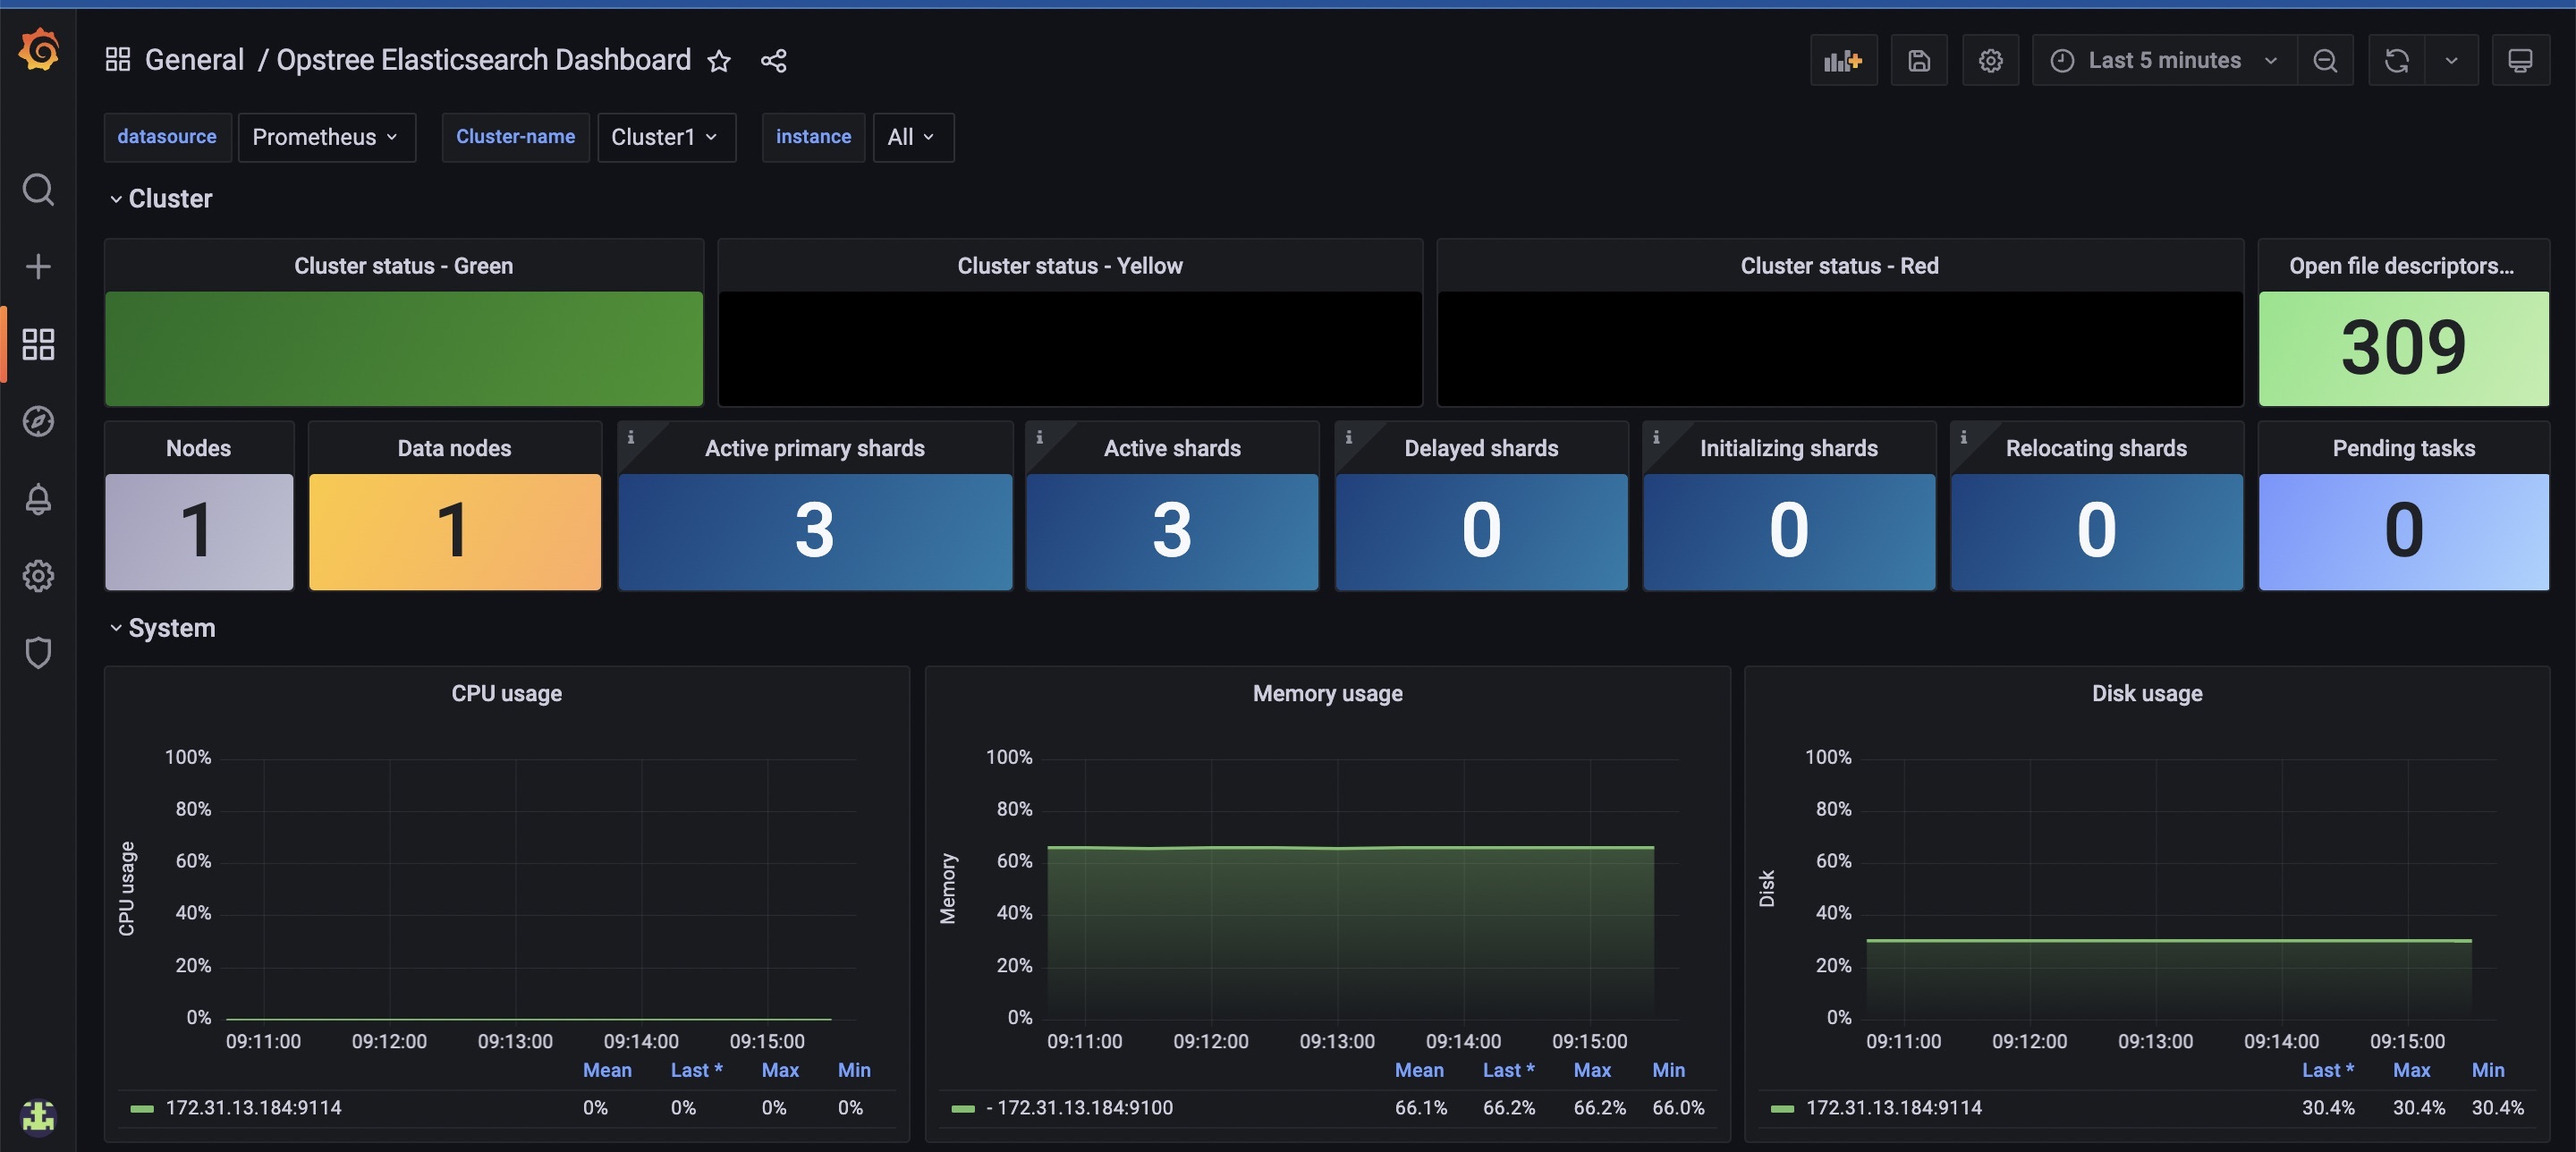
- Cluster Health
- Unassigned Shards
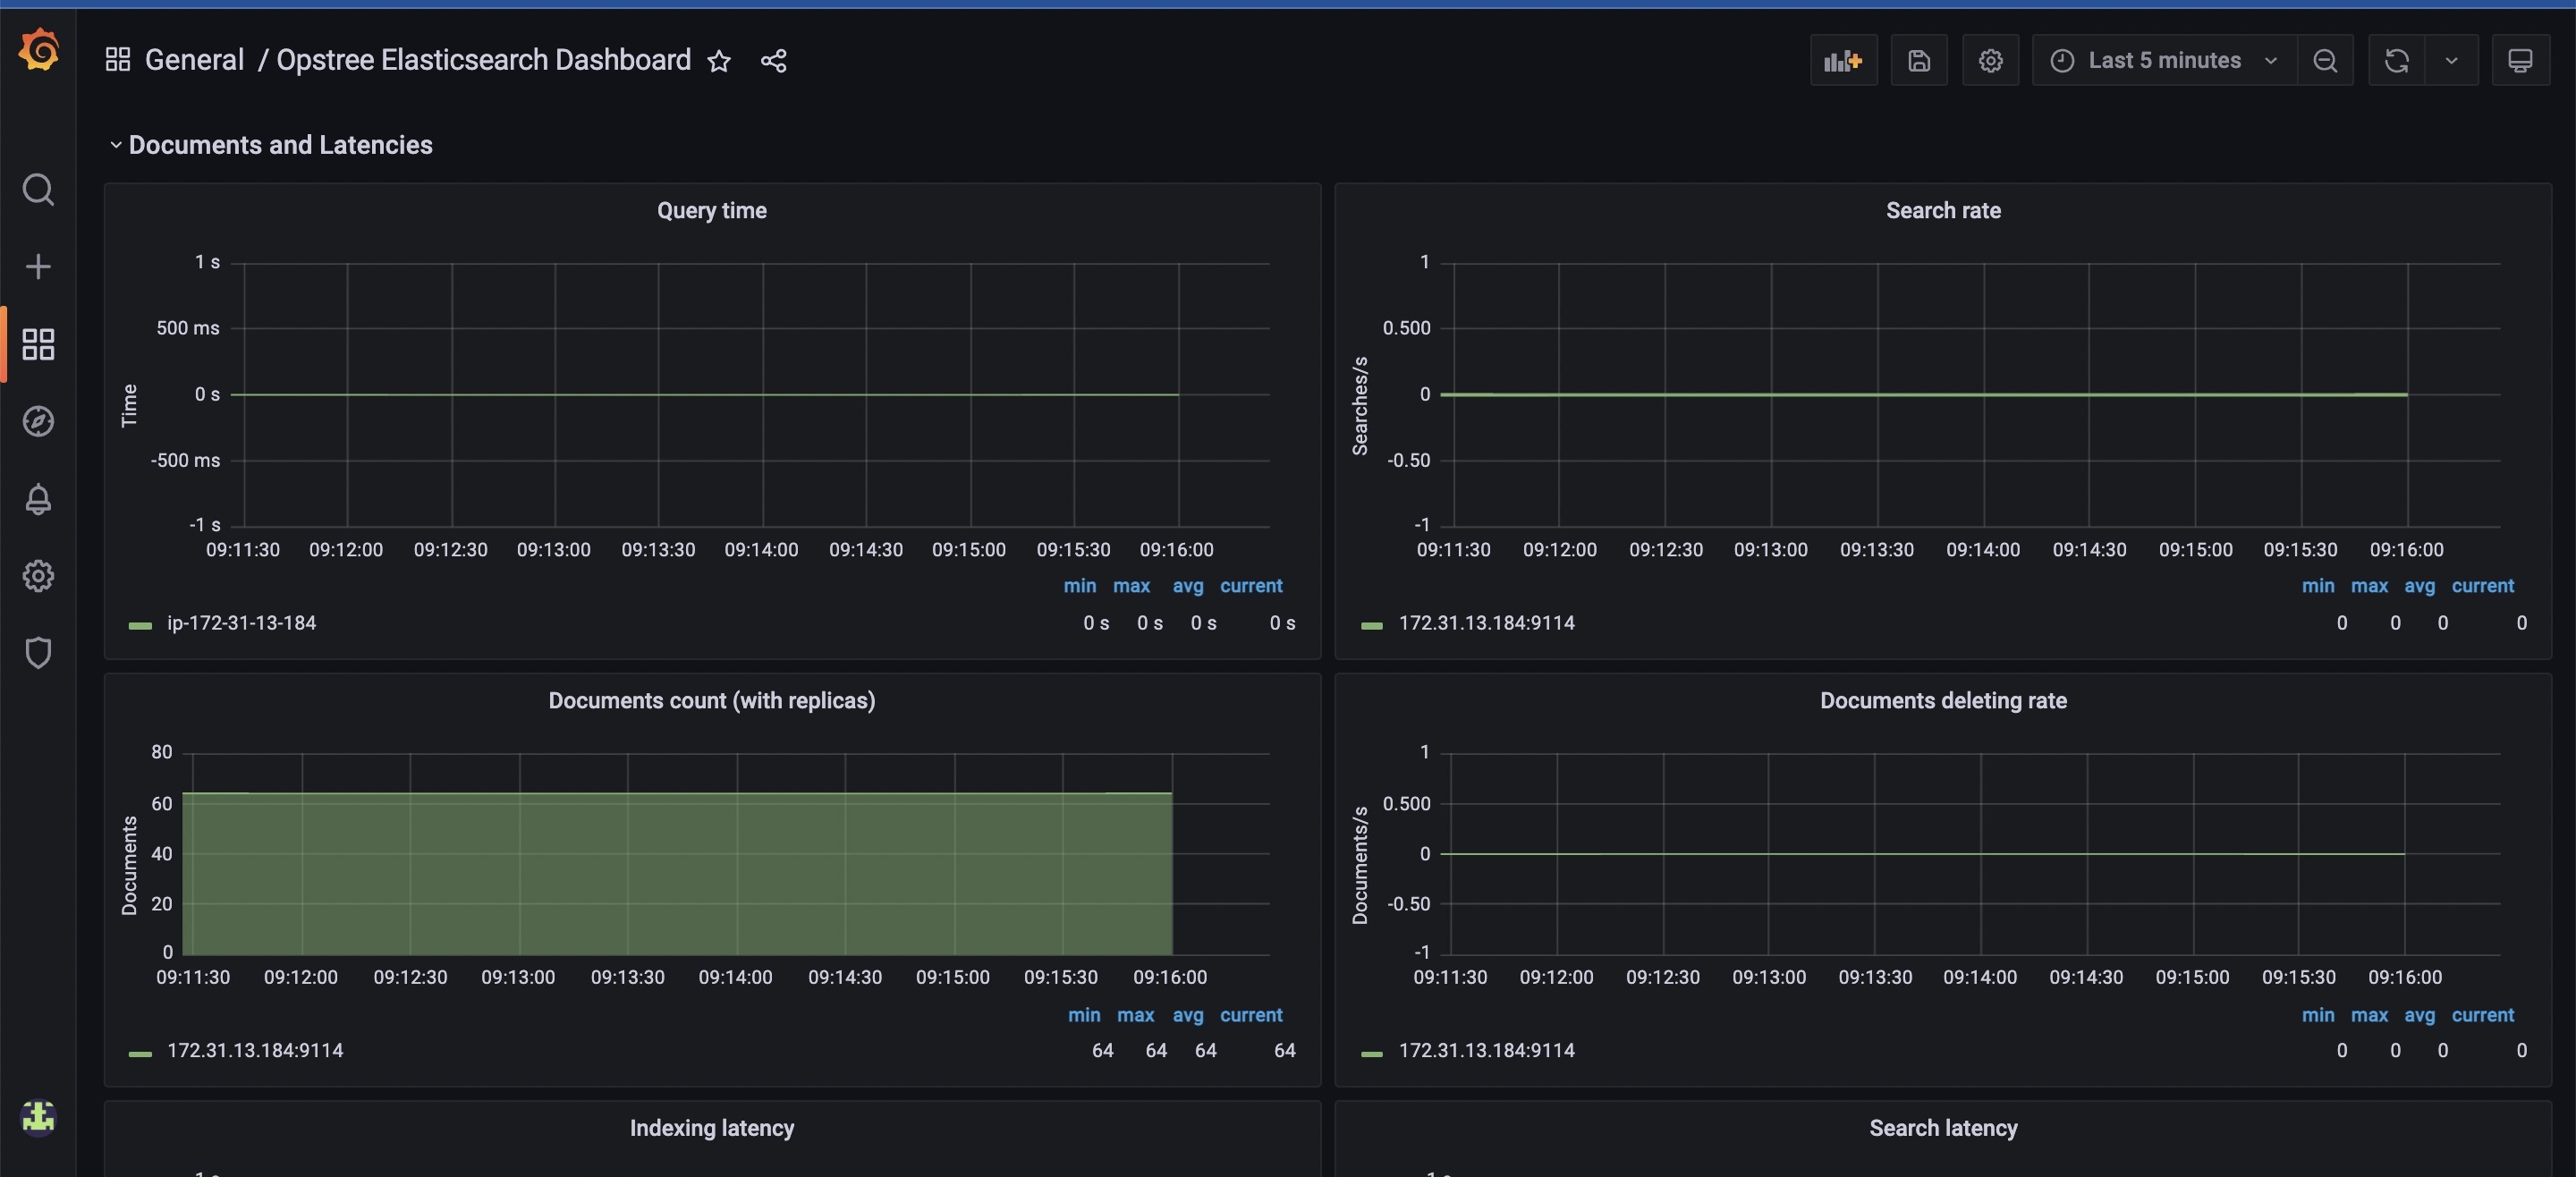
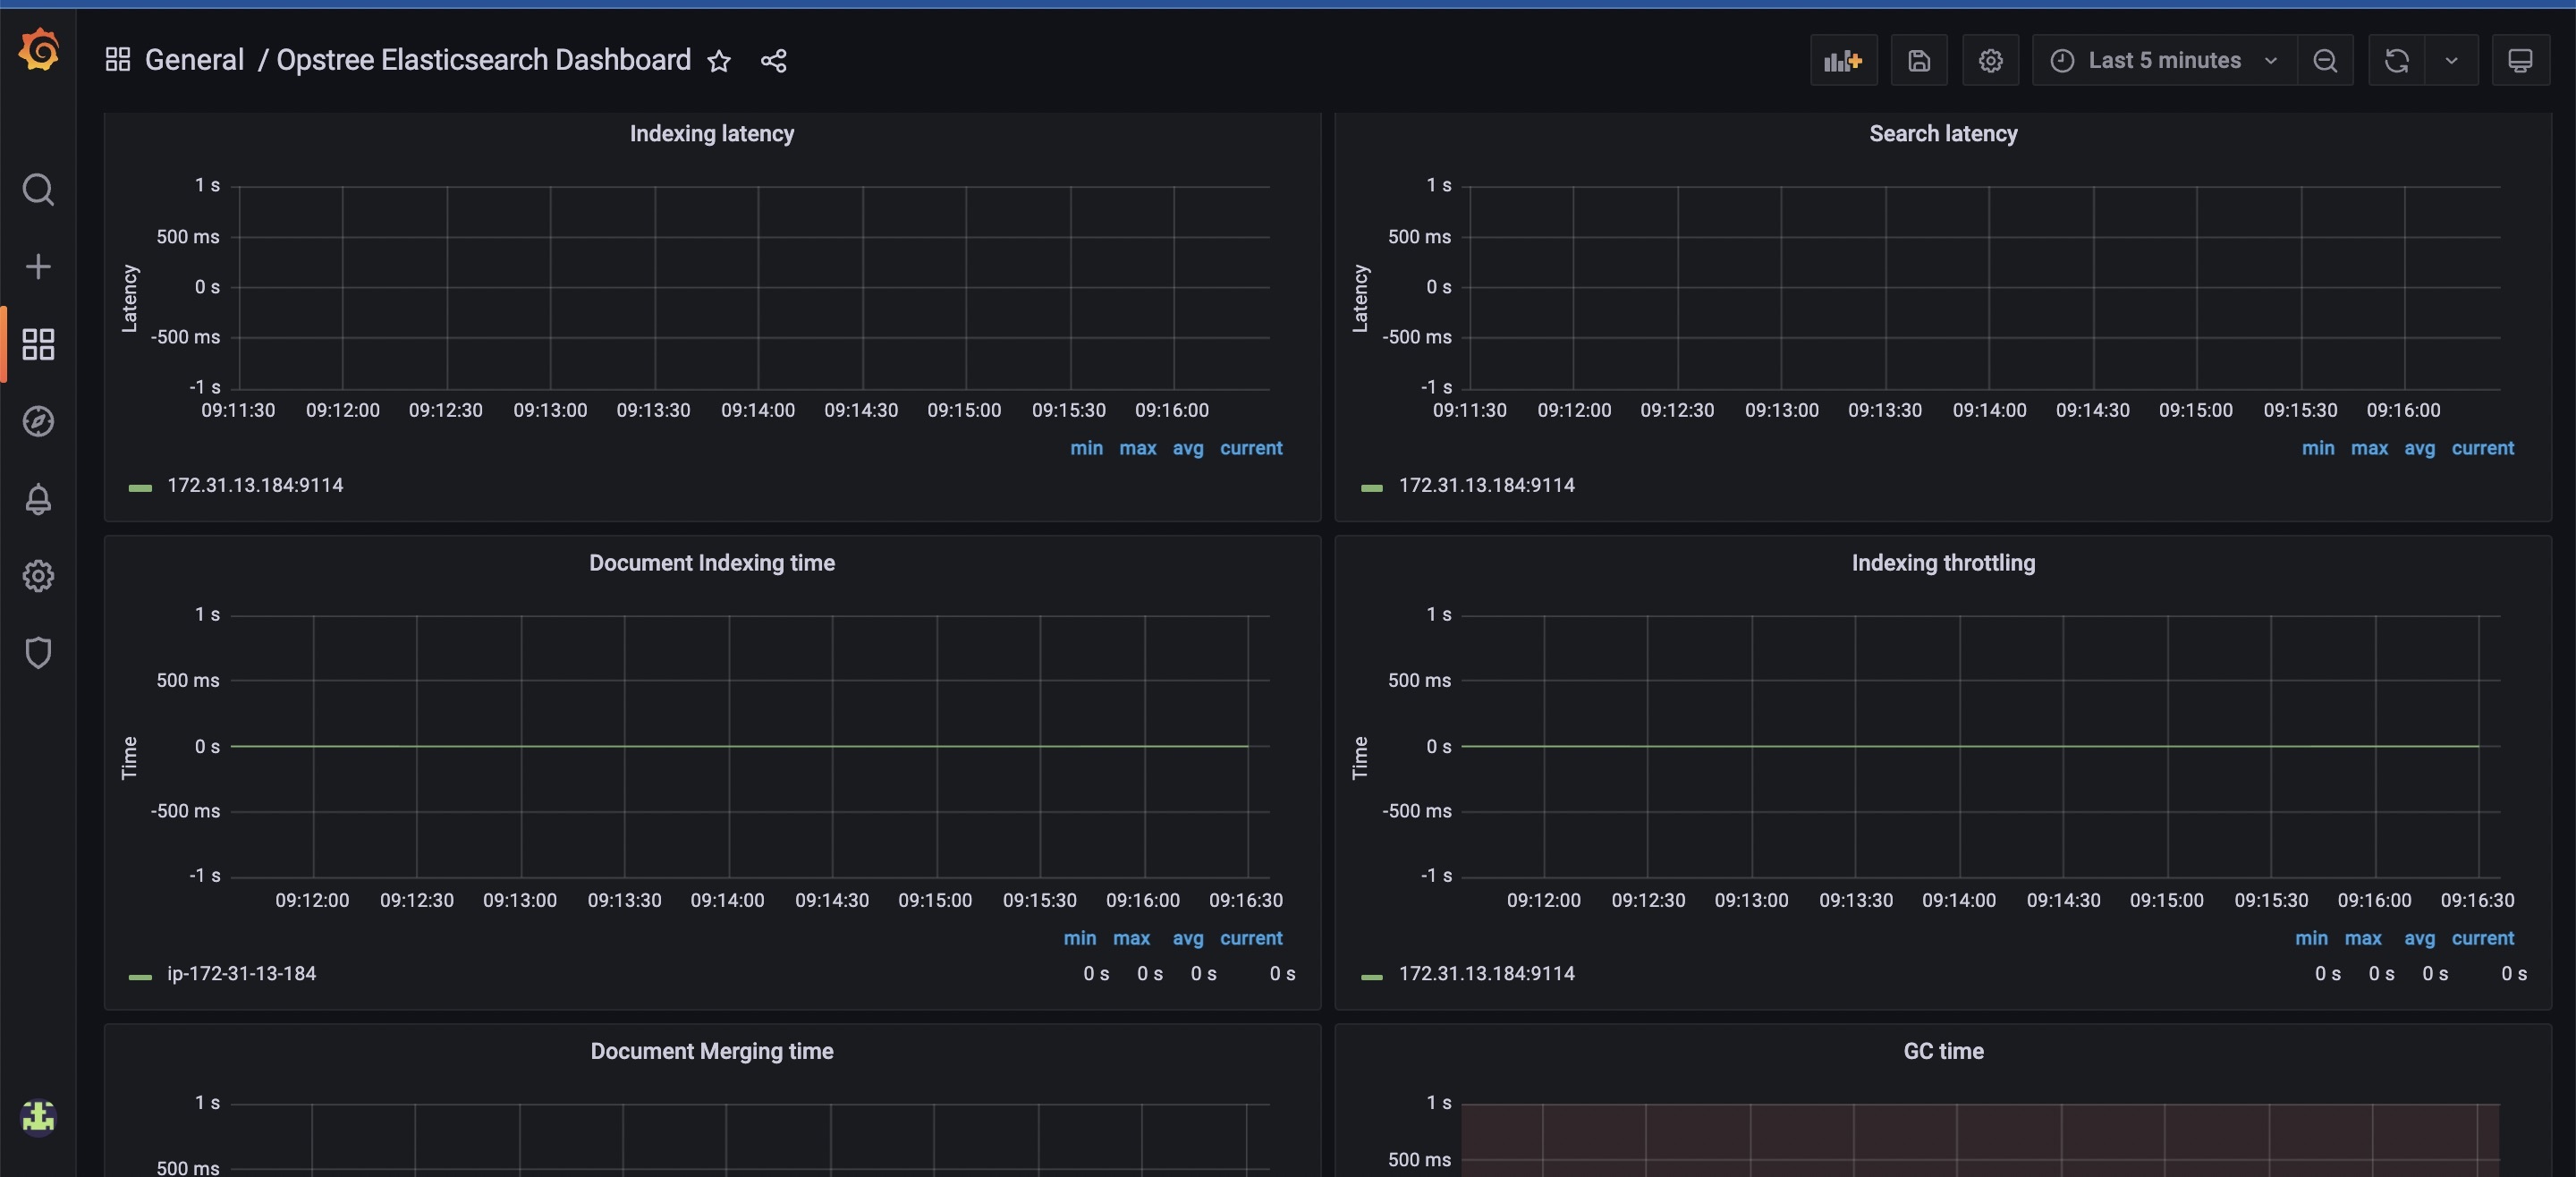
- Query Time
- Active Shard
- Initializing Shards
- Reallocating Shards
- Delayed Shards
- Thread Pool Queued
- Thread Pool Active
- Thread Pool Rejected
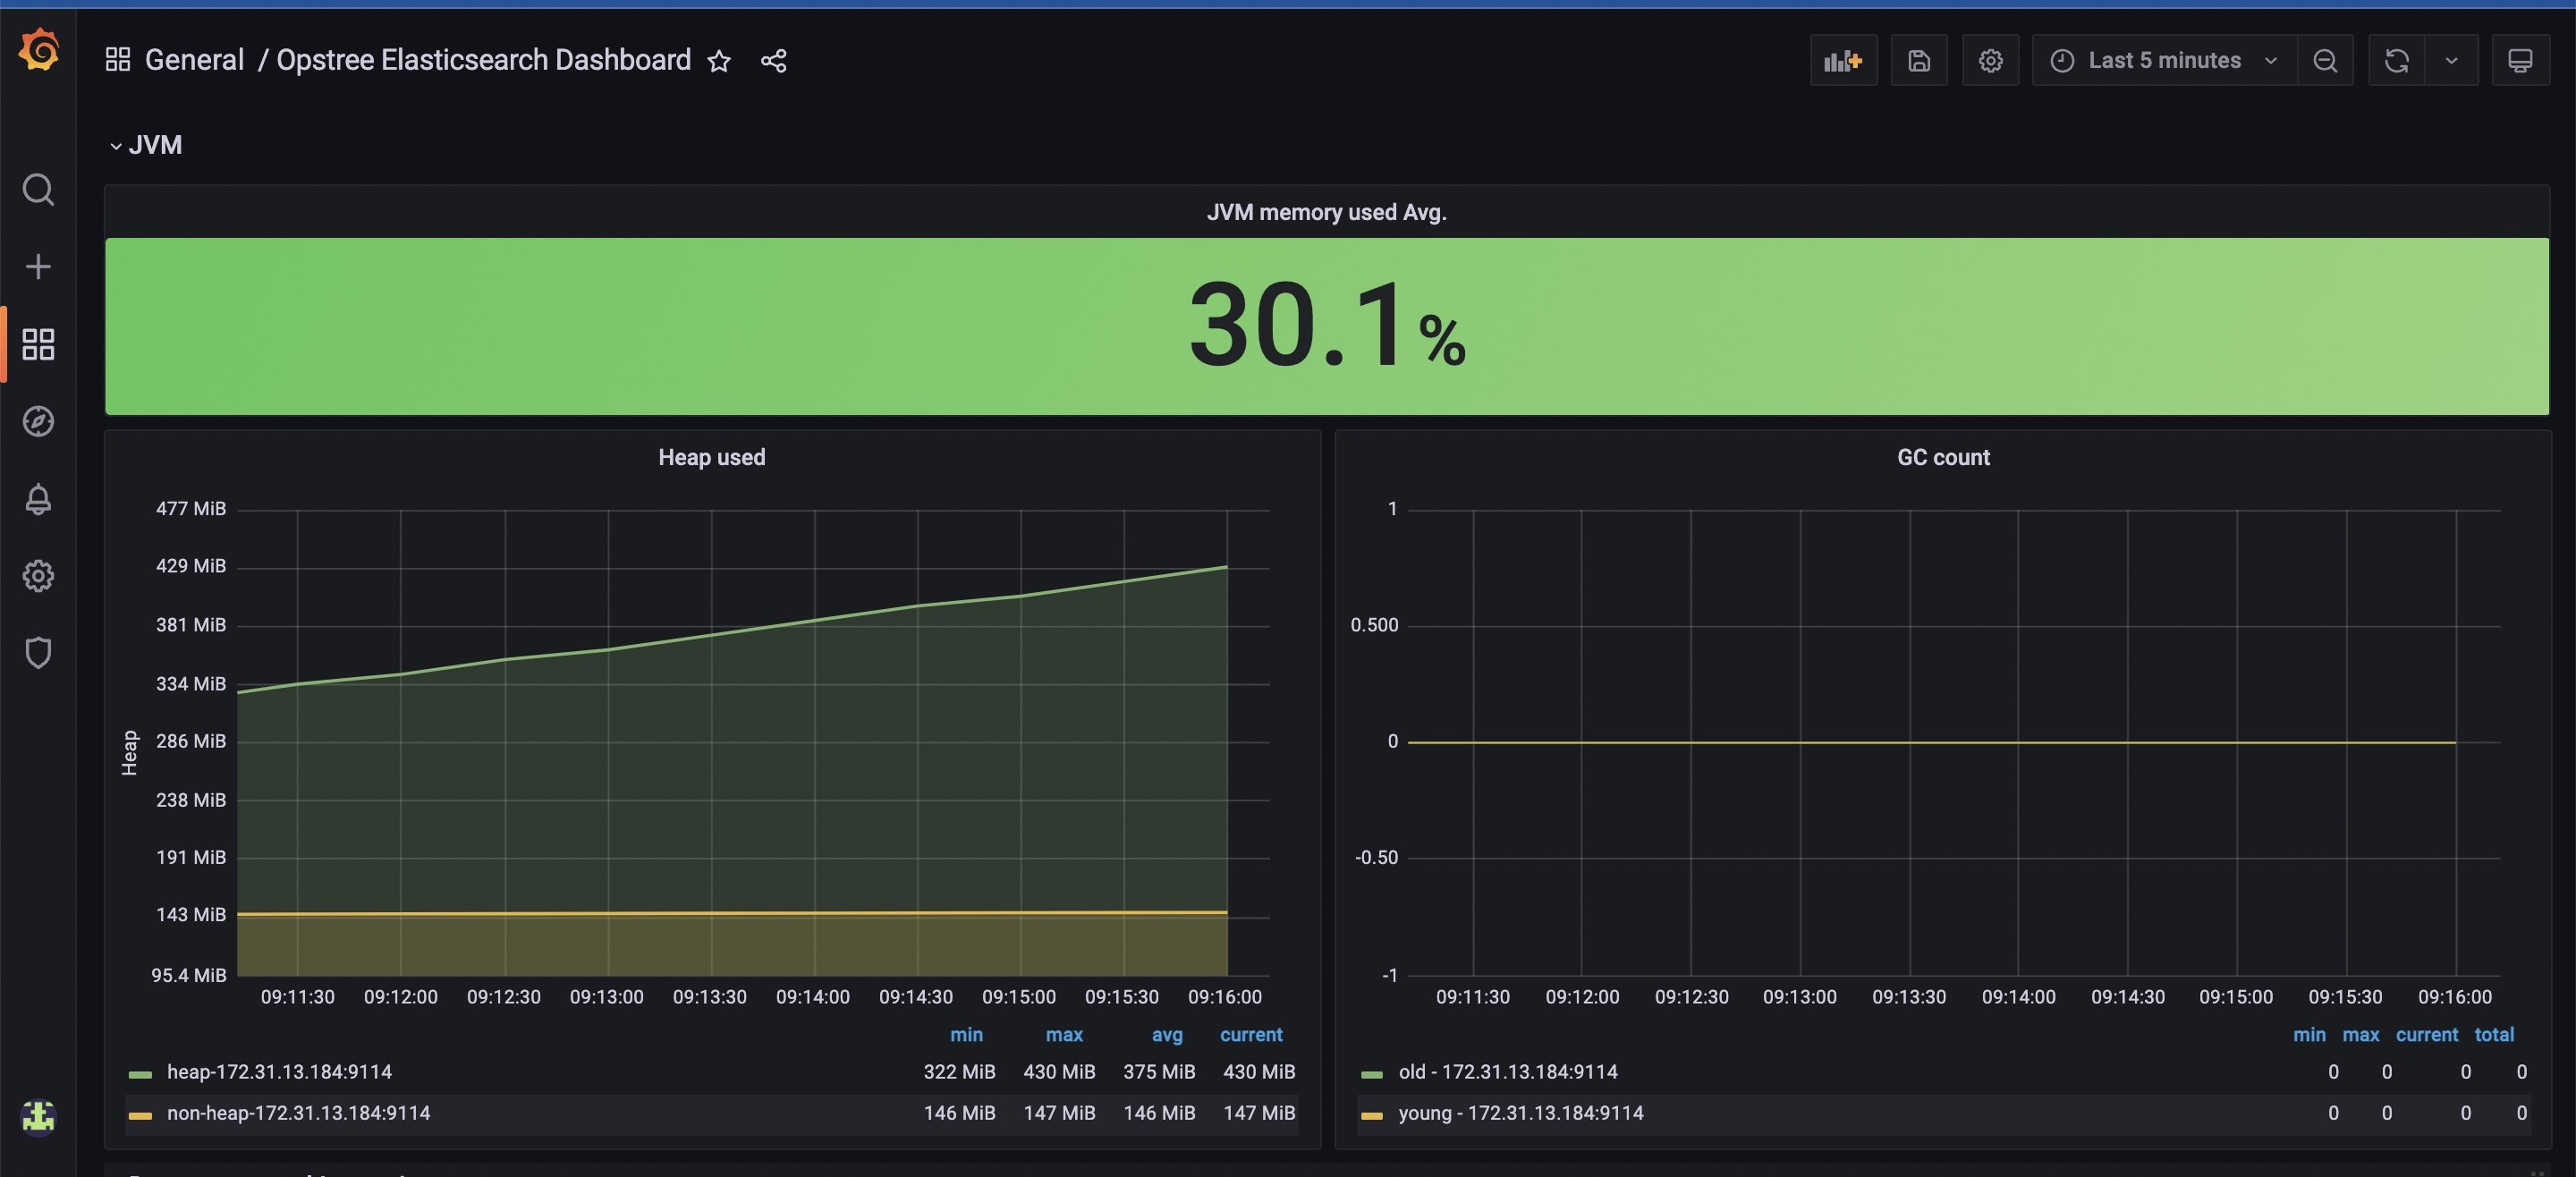
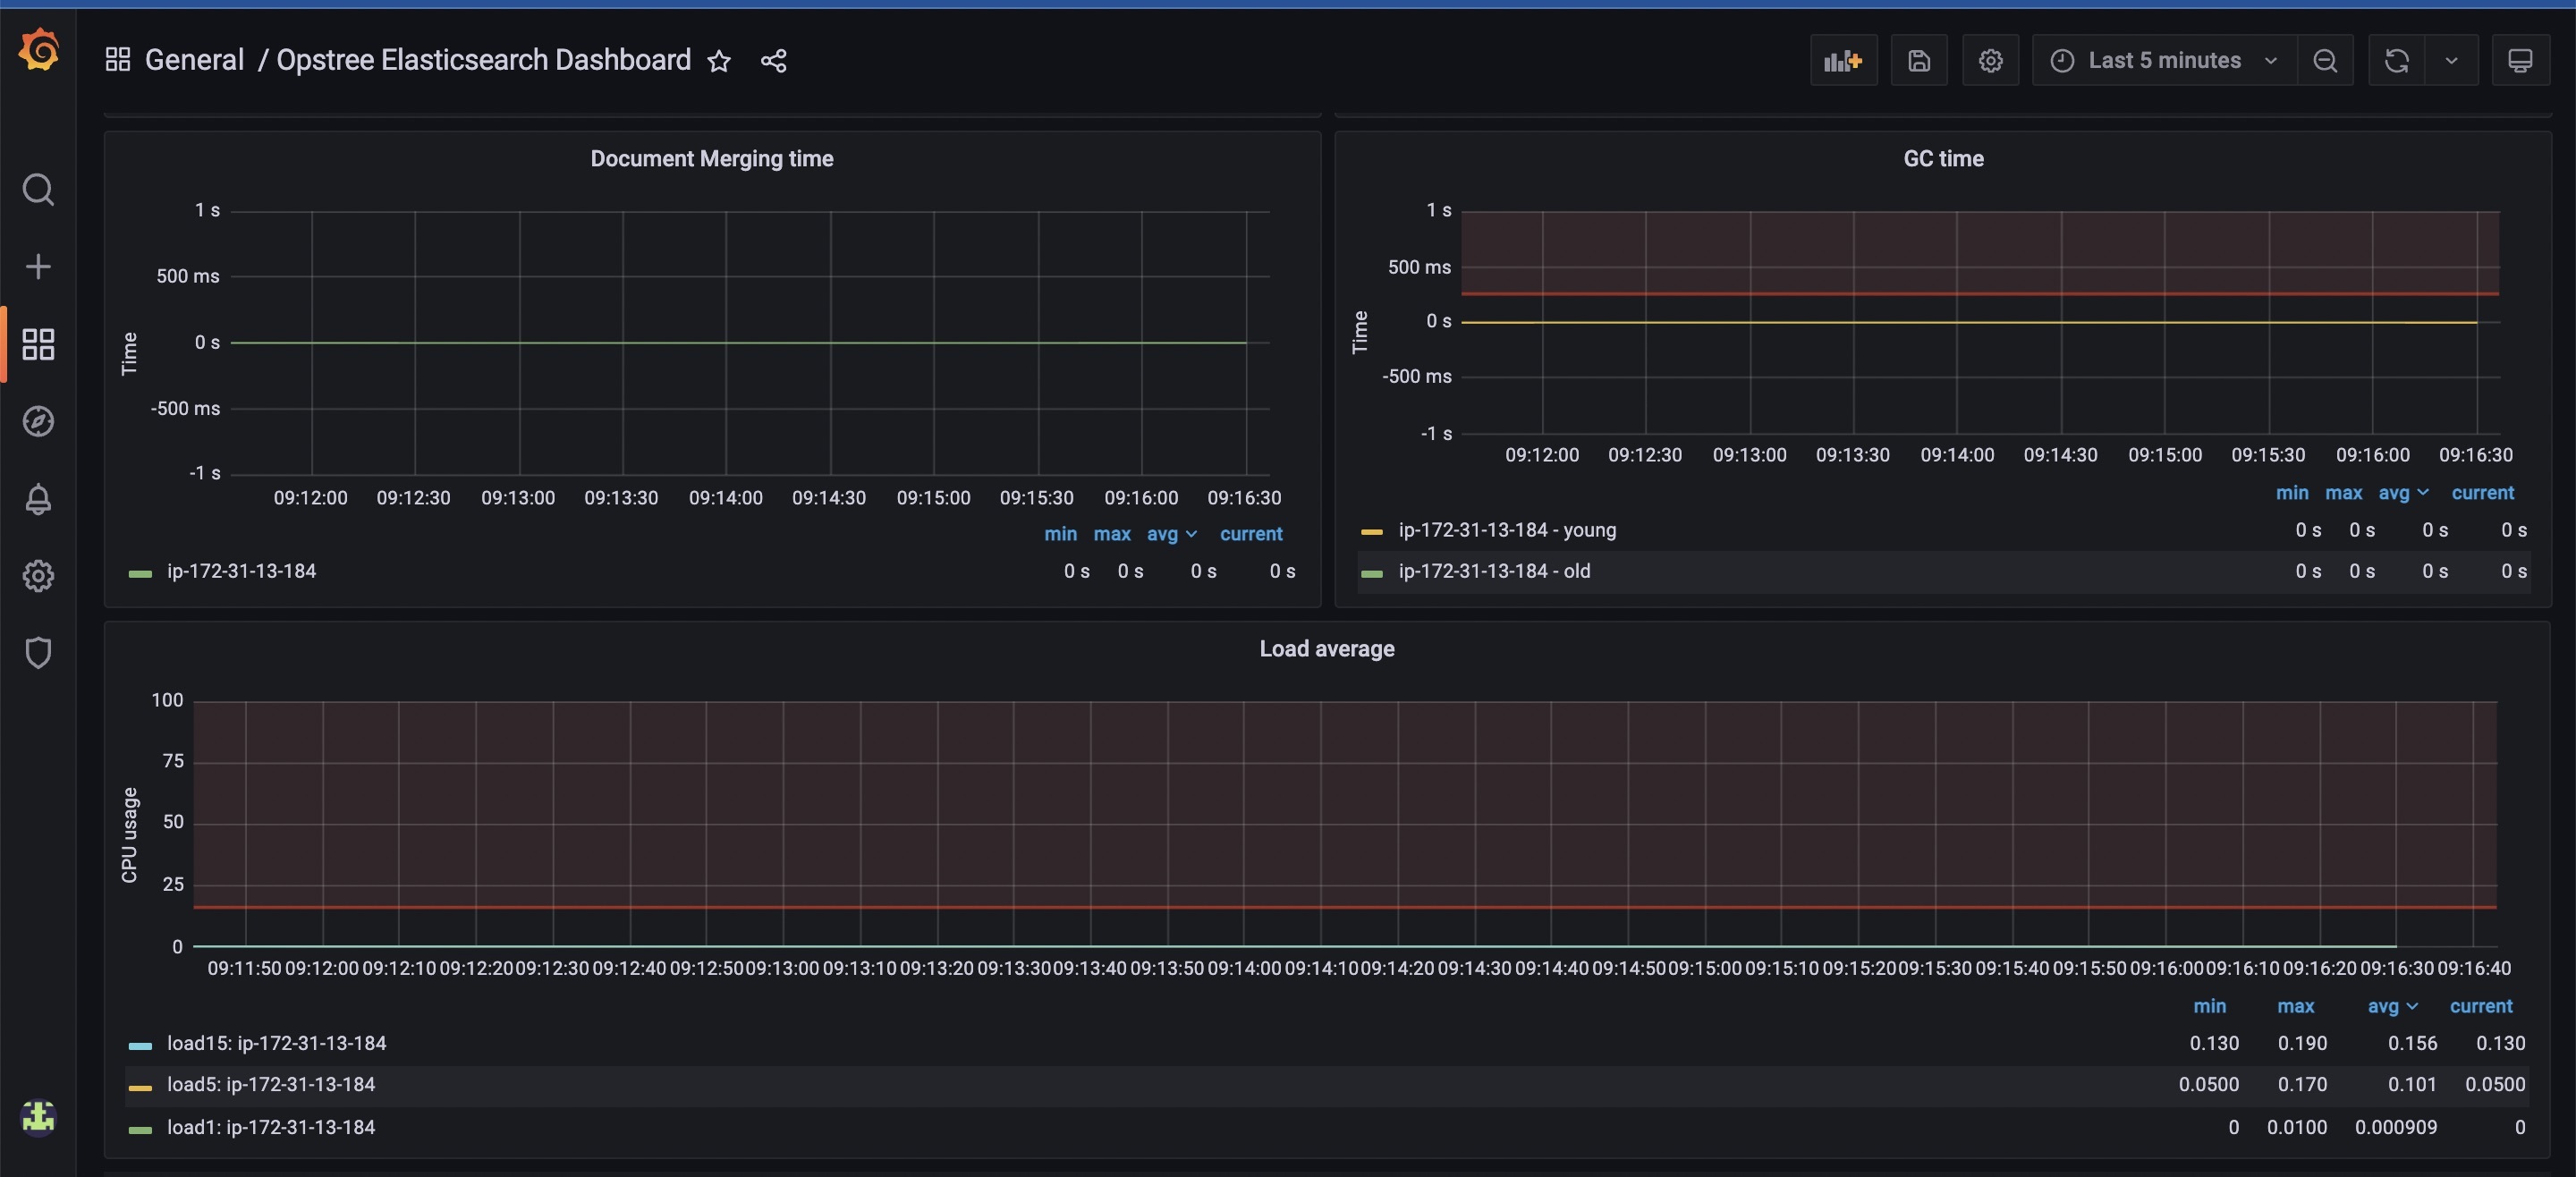
- GC Time
- JVM Heap Utilization
- CPU Utilization
- Load Average
- Indexing Time
- Merging Time
- Node failure
- Disk utilization
Contributor Information
Used Metrics 3434
-
elasticsearch_cluster_health_status
-
elasticsearch_process_open_files_count
-
elasticsearch_cluster_health_number_of_nodes
-
elasticsearch_cluster_health_number_of_data_nodes
-
elasticsearch_cluster_health_active_shards
-
elasticsearch_cluster_health_delayed_unassigned_shards
-
elasticsearch_cluster_health_initializing_shards
-
elasticsearch_cluster_health_relocating_shards
-
elasticsearch_cluster_health_number_of_pending_tasks
-
elasticsearch_process_cpu_percent
-
node_memory_MemTotal_bytes
-
node_memory_MemFree_bytes
-
node_memory_Cached_bytes
-
node_memory_Buffers_bytes
-
elasticsearch_filesystem_data_available_bytes
-
elasticsearch_filesystem_data_size_bytes
-
elasticsearch_jvm_memory_used_bytes
-
elasticsearch_jvm_memory_max_bytes
-
elasticsearch_jvm_gc_collection_seconds_count
-
elasticsearch_indices_search_query_time_seconds
-
elasticsearch_indices_search_query_total
-
elasticsearch_indices_docs
-
elasticsearch_indices_docs_deleted
-
elasticsearch_indices_indexing_index_time_seconds_total
-
elasticsearch_indices_indexing_index_total
-
elasticsearch_indices_store_throttle_time_seconds_total
-
elasticsearch_indices_merges_total_time_seconds_total
-
elasticsearch_jvm_gc_collection_seconds_sum
-
elasticsearch_os_load1
-
elasticsearch_os_load5
-
elasticsearch_os_load15
-
elasticsearch_thread_pool_completed_count
-
elasticsearch_thread_pool_active_count
-
elasticsearch_thread_pool_rejected_count