Prometheus system 23,87423,874 3.0 (1 reviews)
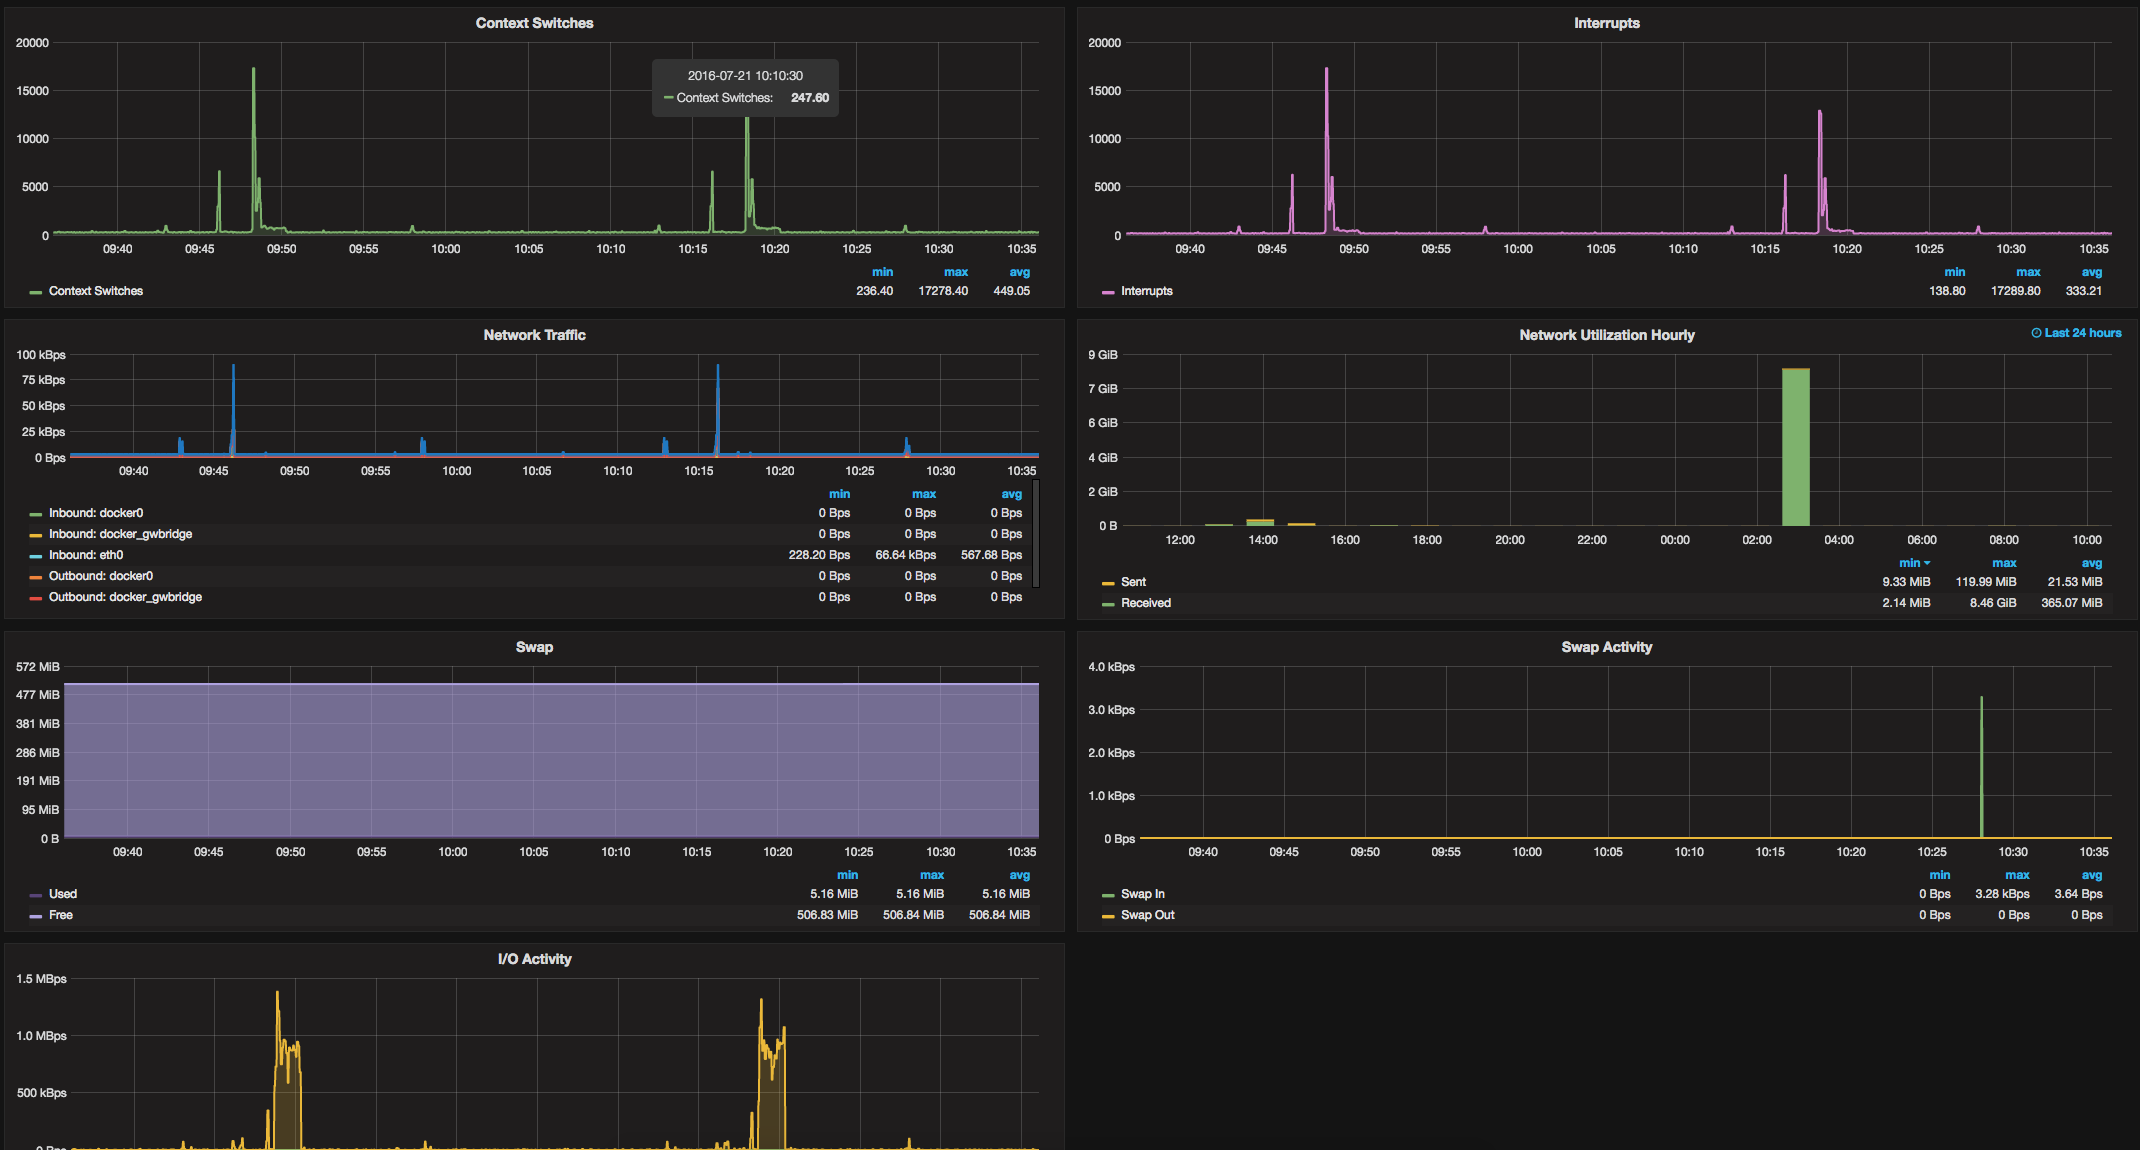
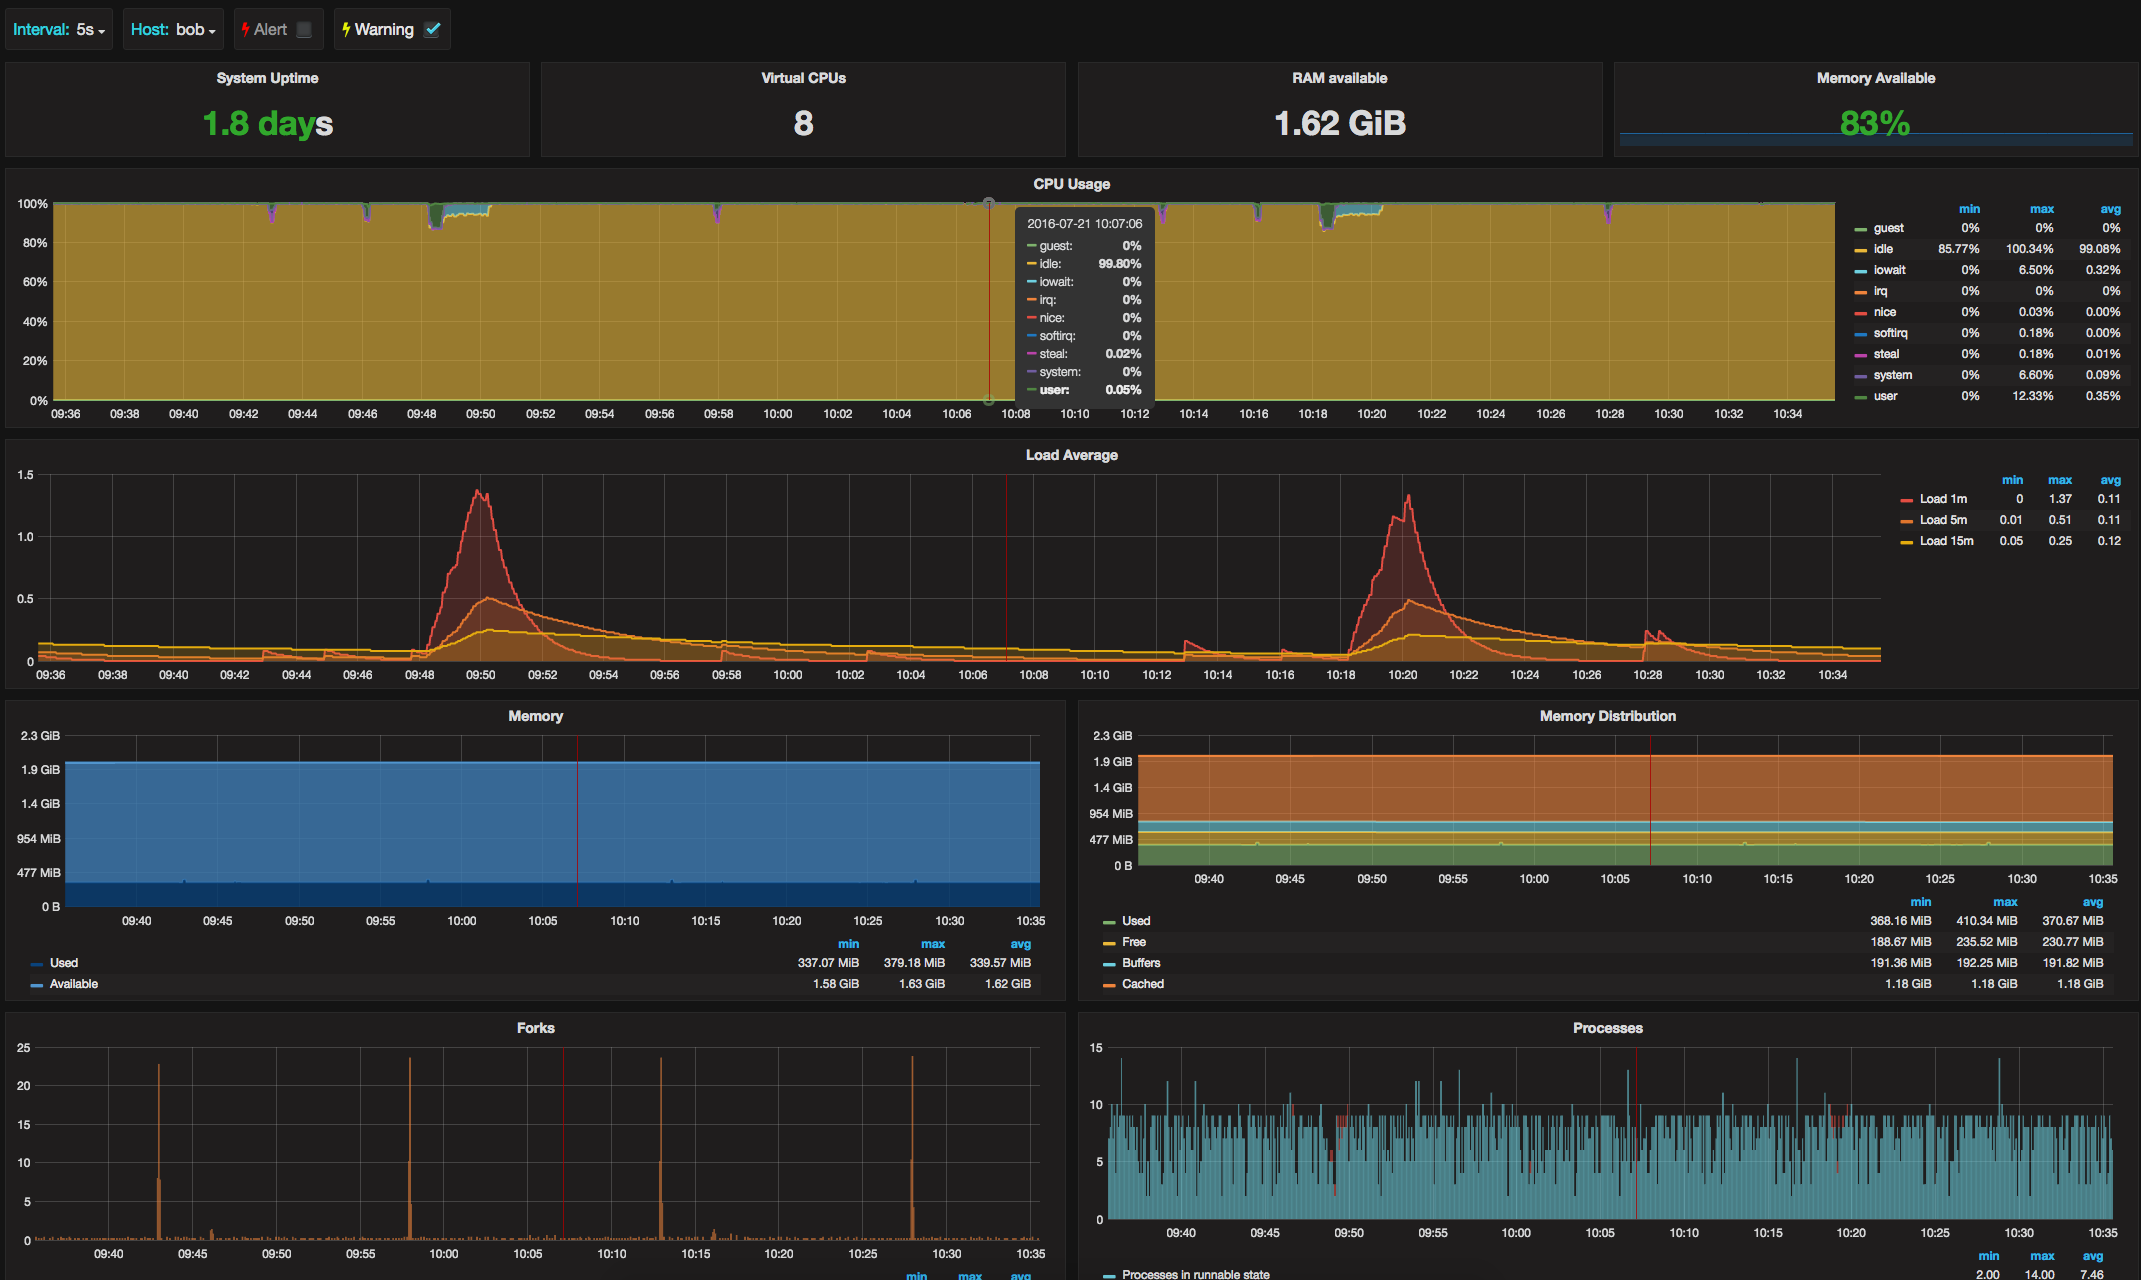
Show classical system metrics of your servers. It's also linked alerts of the selected servers (if alert are set). Need to use tag name for servers. The tag used is "alias" but you can change it in templating.
Open issues or give feedback at : https://github.com/tcheronneau/grafana_dashboard
Used Metrics 2727
-
node_time_seconds
-
node_boot_time_seconds
-
node_cpu_seconds_total
-
node_memory_MemAvailable_bytes
-
node_memory_MemFree_bytes
-
node_memory_Buffers_bytes
-
node_memory_Cached_bytes
-
node_memory_MemTotal_bytes
interval
-
node_load1
-
node_load5
-
node_load15
-
node_forks_total
-
node_procs_running
-
node_procs_blocked
-
node_context_switches_total
-
node_intr_total
-
node_network_receive_bytes_total
-
node_network_transmit_bytes_total
node_network_receive_bytes
node_network_transmit_bytes
-
node_memory_SwapTotal_bytes
-
node_memory_SwapFree_bytes
-
node_vmstat_pswpin
-
node_vmstat_pswpout
-
node_vmstat_pgpgin
-
node_vmstat_pgpgout