Kubecost Dashboard for Grafana Cloud 2,0402,040
Grafana Dashboard for Kubecost+Grafana Cloud
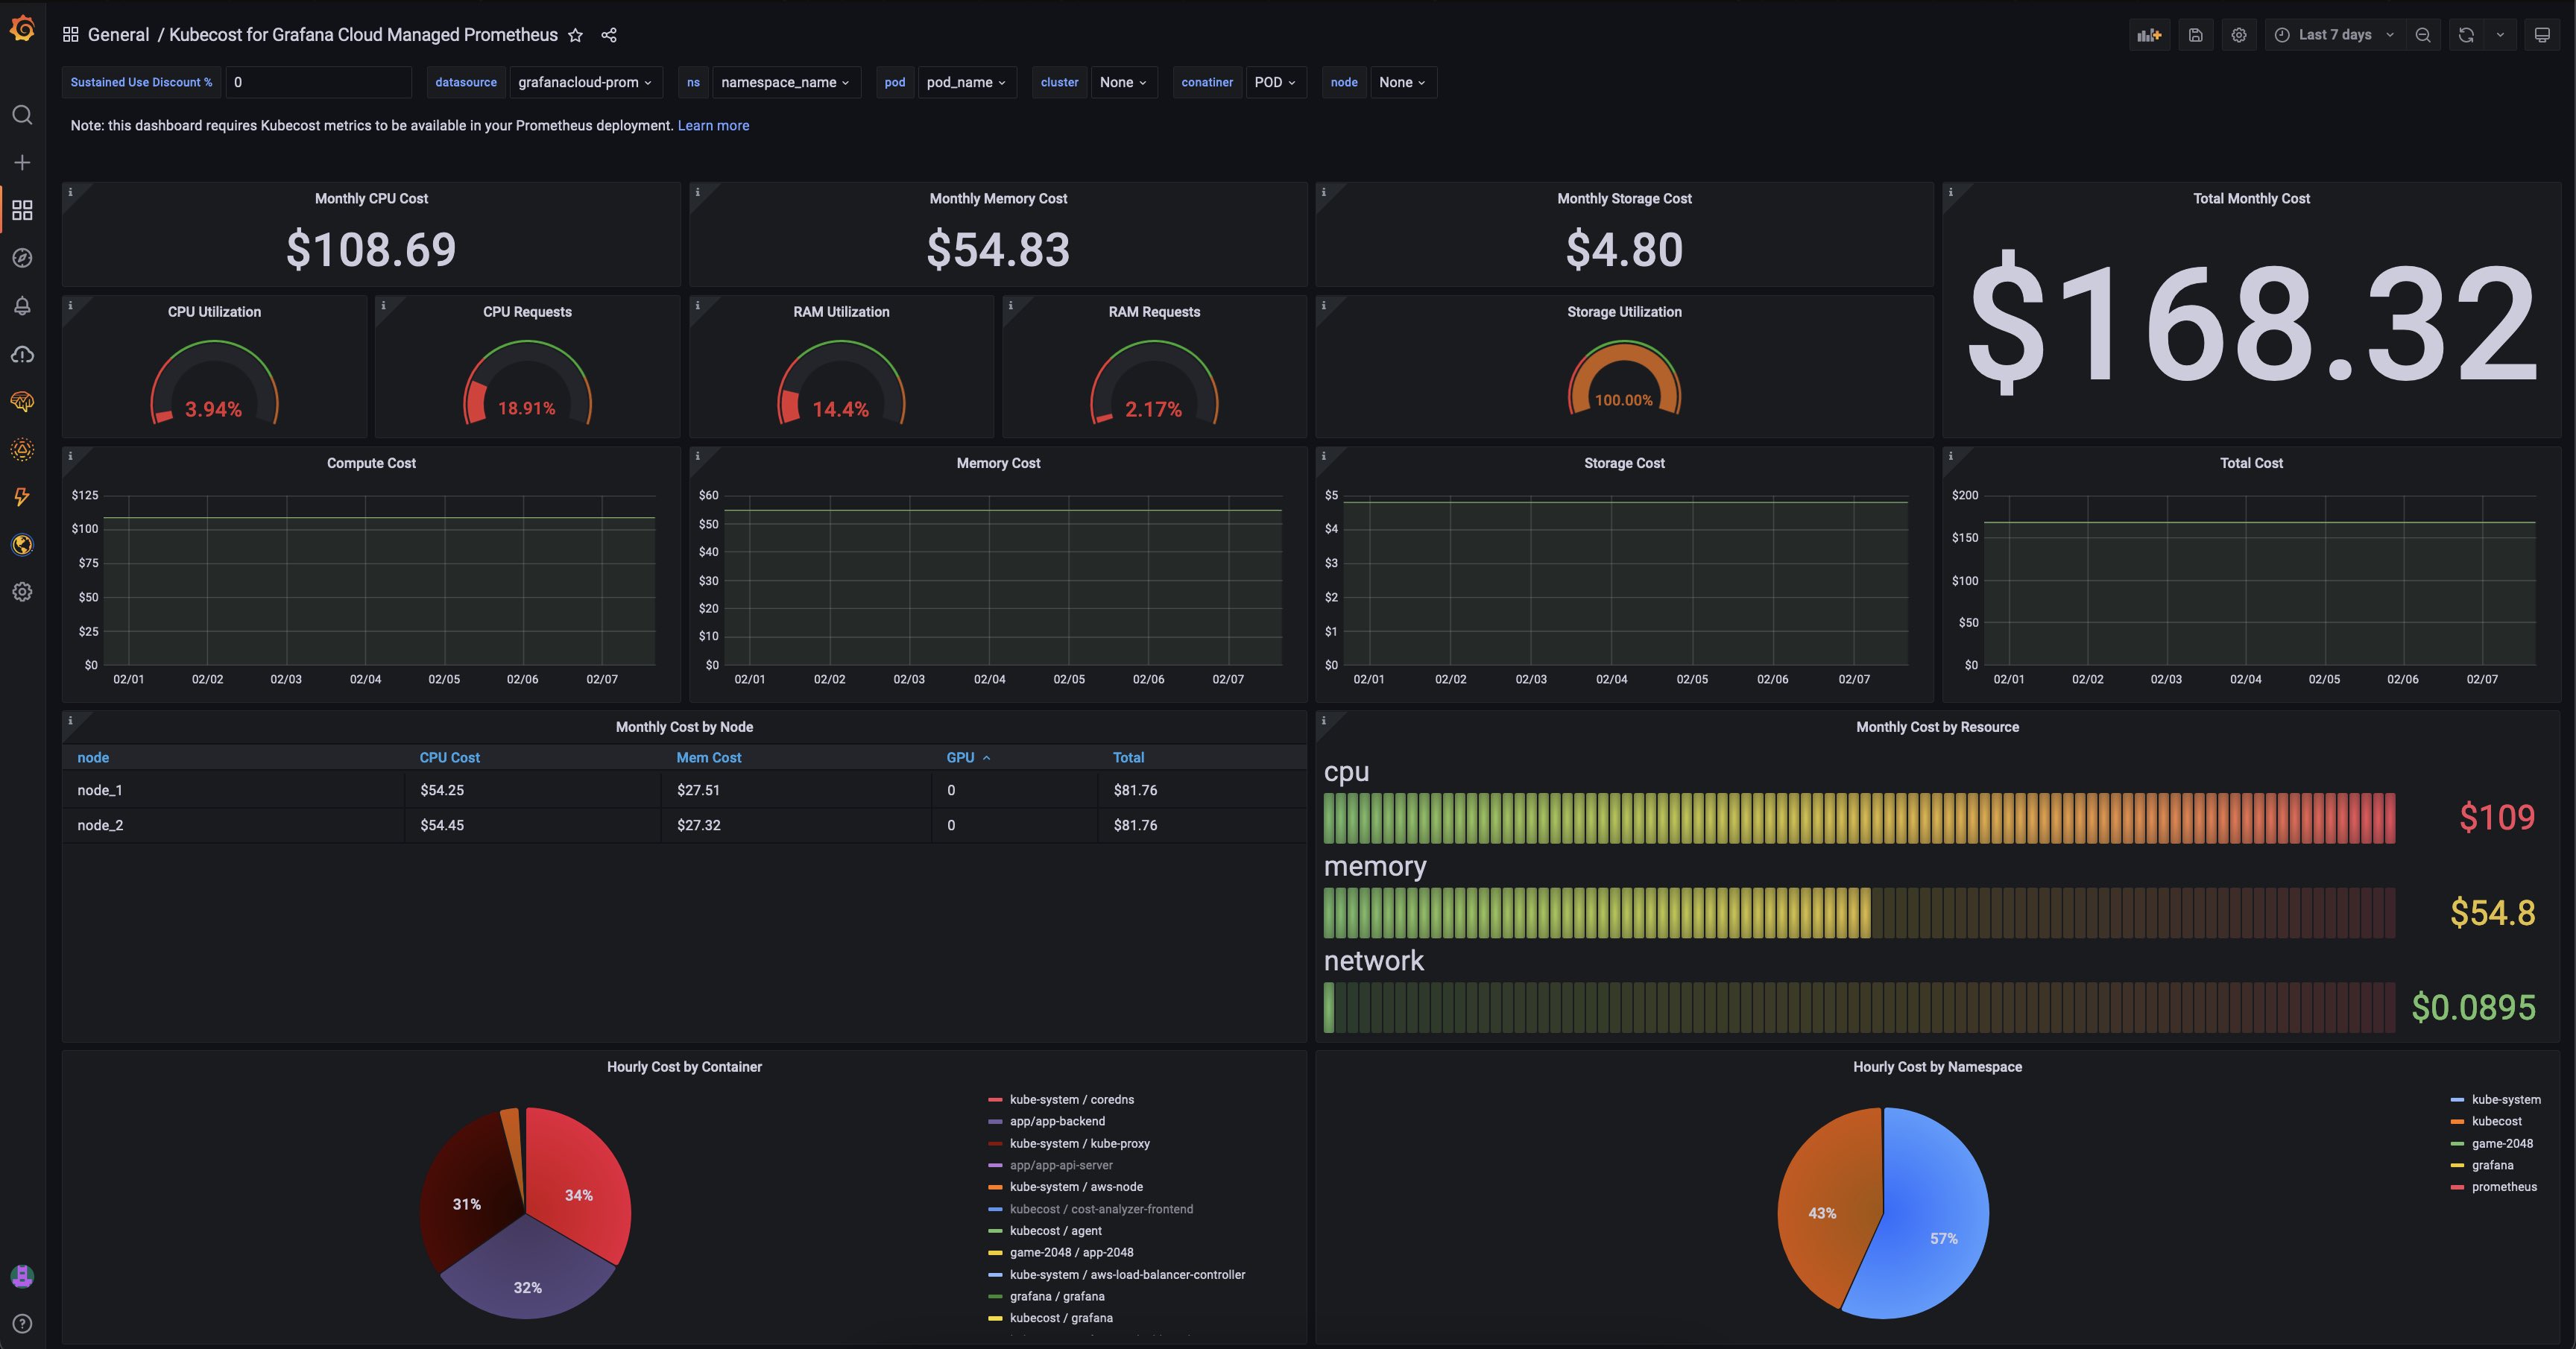
This Dashboard provides customers leveraging the Grafana Cloud Managed Prometheus with a way to visualise their cost spend.
If you haven't set up Kubecost to query the Grafana Cloud Managed Prometheus, please see the documentation.
Once you've set it up, simply copy the URL of this dashboard and import it into your Grafana Cloud dashboards. Make sure to select the Managed Prometheus as a data source for the Kubecost dashboard.
Used Metrics 3232
kube_node_status_capacity
node_cpu_hourly_cost
useDiscount
node_gpu_hourly_cost
node_ram_hourly_cost
pv_hourly_cost
kube_persistentvolume_capacity_bytes
-
container_fs_limit_bytes
localStorageGBCost
Compute
Memory
Storage
-
container_cpu_usage_seconds_total
kube_node_status_allocatable
kube_pod_container_resource_requests
-
container_memory_working_set_bytes
kube_persistentvolumeclaim_info
pod_pvc_allocation
-
up
-
container_fs_usage_bytes
kube_persistentvolumeclaim_resource_requests_storage_bytes
timeRange
CPU
GPU
-
node_network_transmit_bytes_total
percentEgress
egressCost
container_memory_allocation_bytes
kube_node_labels
instance_type
label_node_kubernetes_io_instance_type
container_cpu_allocation