MySQL Cluster Overview 12,35912,359
Dashboard for MySQL Galera Monitoring from Bitnami MySQL exporter https://hub.docker.com/r/bitnami/mysqld-exporter/.
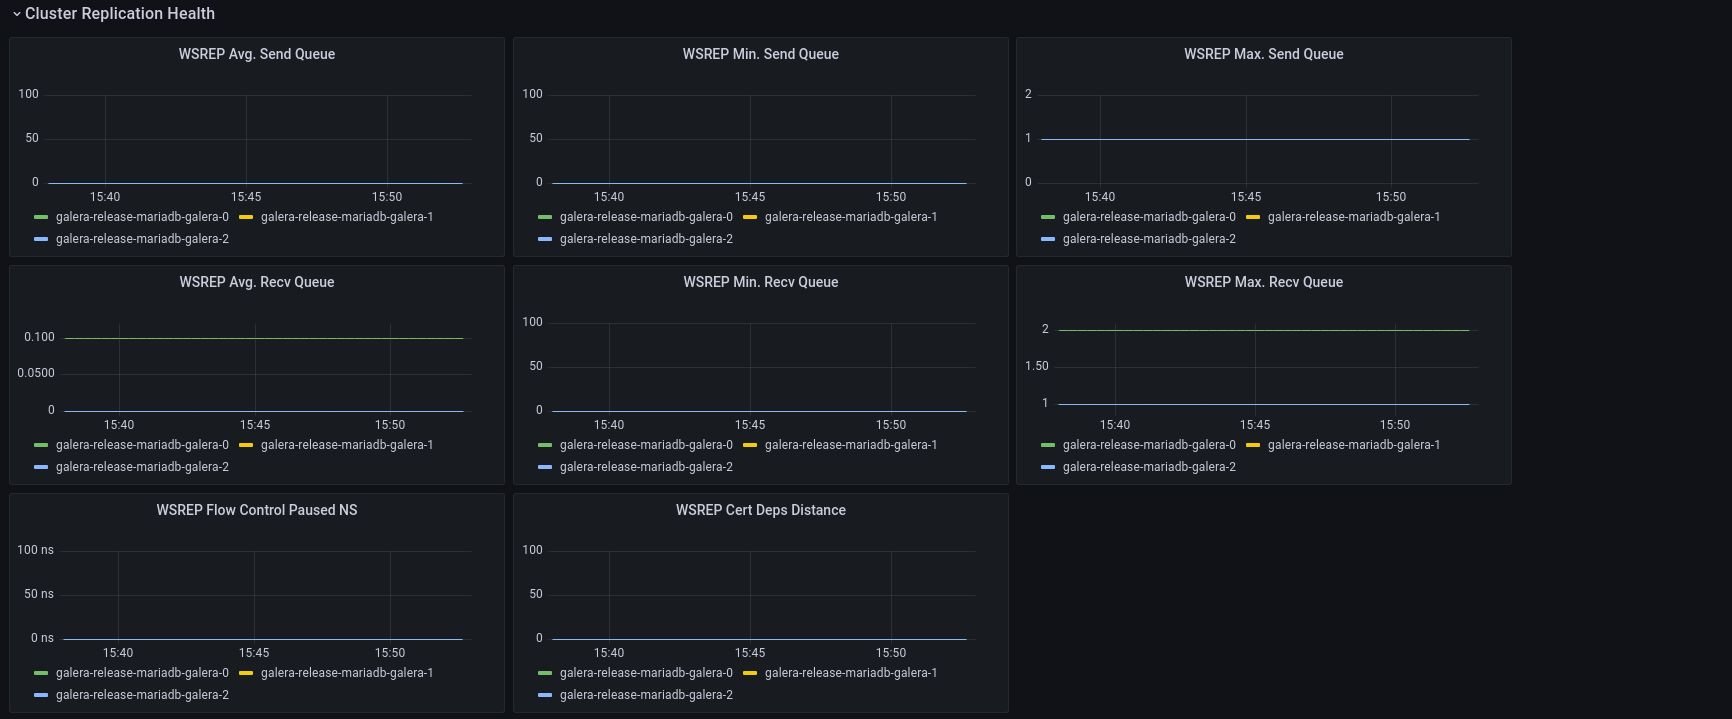
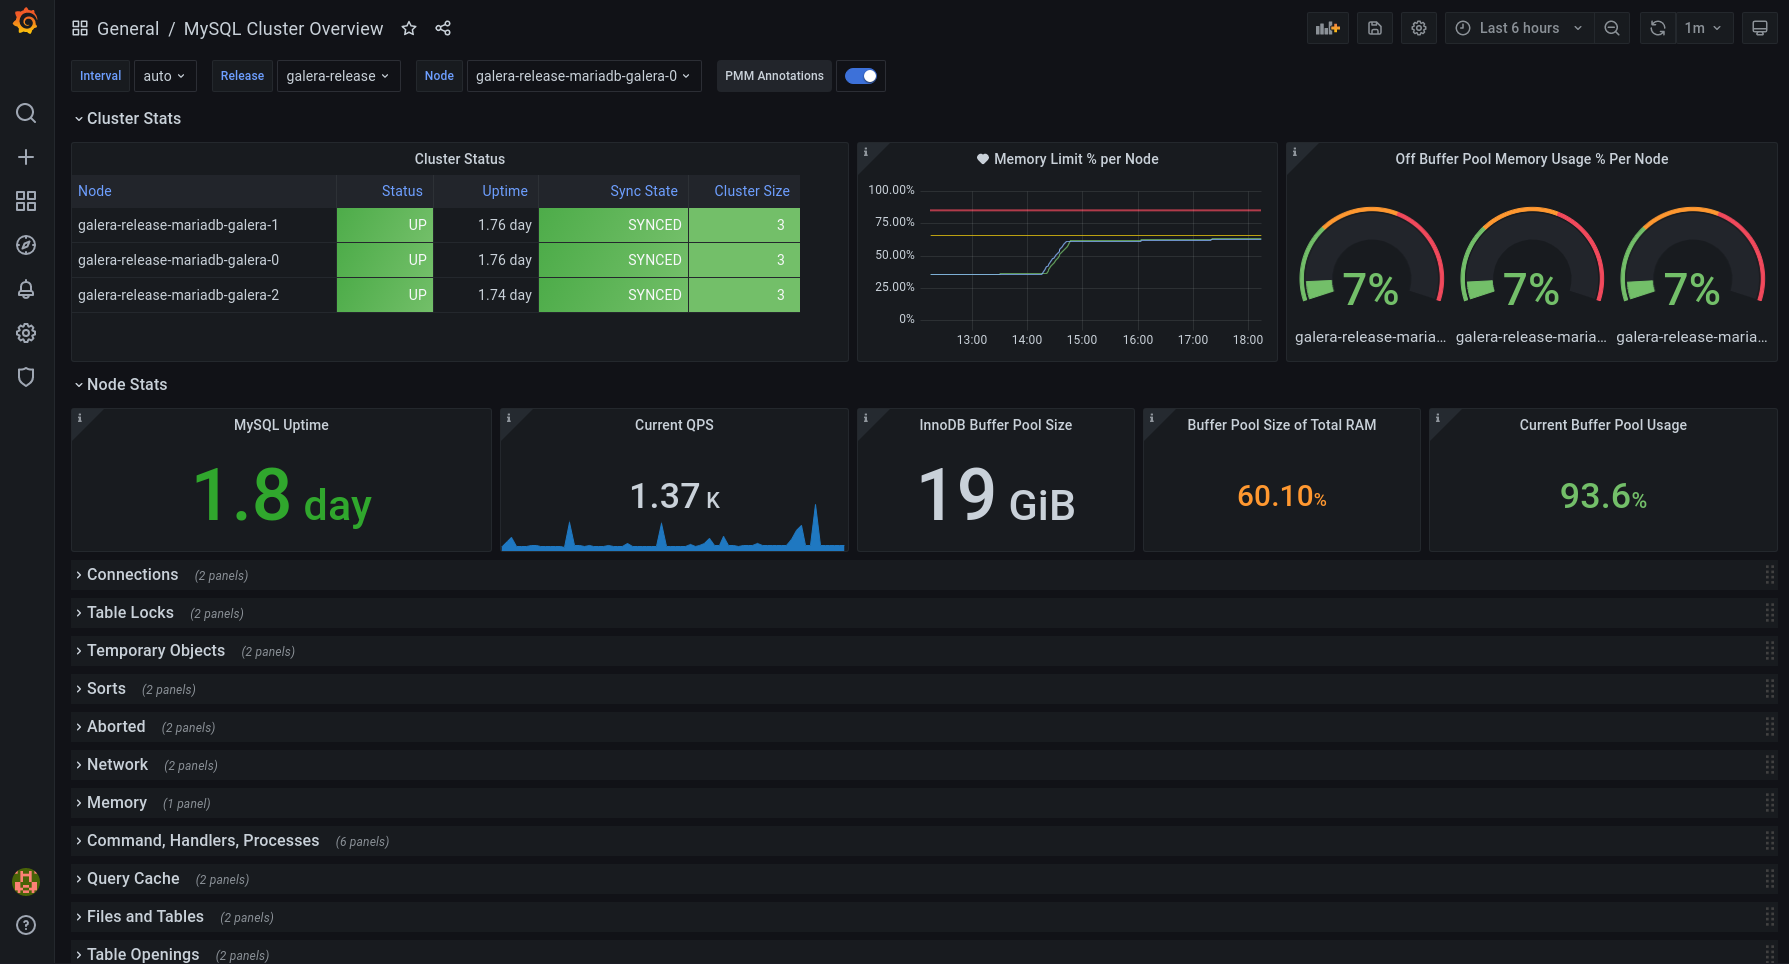
All the dashboard variables are templated based on a k8s based deployment, so they reference "Pod", but this can changed to something else depending on your deployment. The important thing is that all the major metrics are there in the dashboard, along with a useful description in almost all the panels.
Adjusting these template variables - specifically "Release" should allow you to monitor any/all MySQL clusters that Prometheus is scraping.
Based off of a few other MySQL/Galera dashboads I've seen around, with a few extra panels added.
Happy monitoring!

Used Metrics 3434
-
mysql_global_status_uptime
-
mysql_up
mysql_global_status_wsrep_local_state
mysql_global_status_wsrep_cluster_size
-
container_memory_working_set_bytes
container
mariadb
galera
kube_pod_container_resource_limits
resource
memory
-
mysql_global_status_innodb_page_size
-
mysql_global_status_buffer_pool_pages
-
mysql_global_status_queries
interval
-
mysql_global_variables_innodb_buffer_pool_size
-
node_vmstat_pgpgin
-
node_vmstat_pgpgout
-
node_memory_MemTotal_bytes
-
node_memory_MemFree_bytes
-
node_memory_Buffers_bytes
-
node_memory_Cached_bytes
node_memory_Cached
-
node_vmstat_pswpin
-
node_vmstat_pswpout
-
node_disk_read_bytes_total
-
node_disk_written_bytes_total
-
node_disk_io_time_seconds_total
-
node_network_receive_bytes_total
rdsosmetrics_network_rx
-
node_network_transmit_bytes_total
rdsosmetrics_network_tx
-
node_filesystem_size_bytes
-
node_filesystem_avail_bytes