Nginx 20,806,75720,806,757 5.0 (1 reviews)
8/21/2021
6/3/2022
2
AWSDockerHost MetricsWeb Servers
>=7.0.1
Prometheus
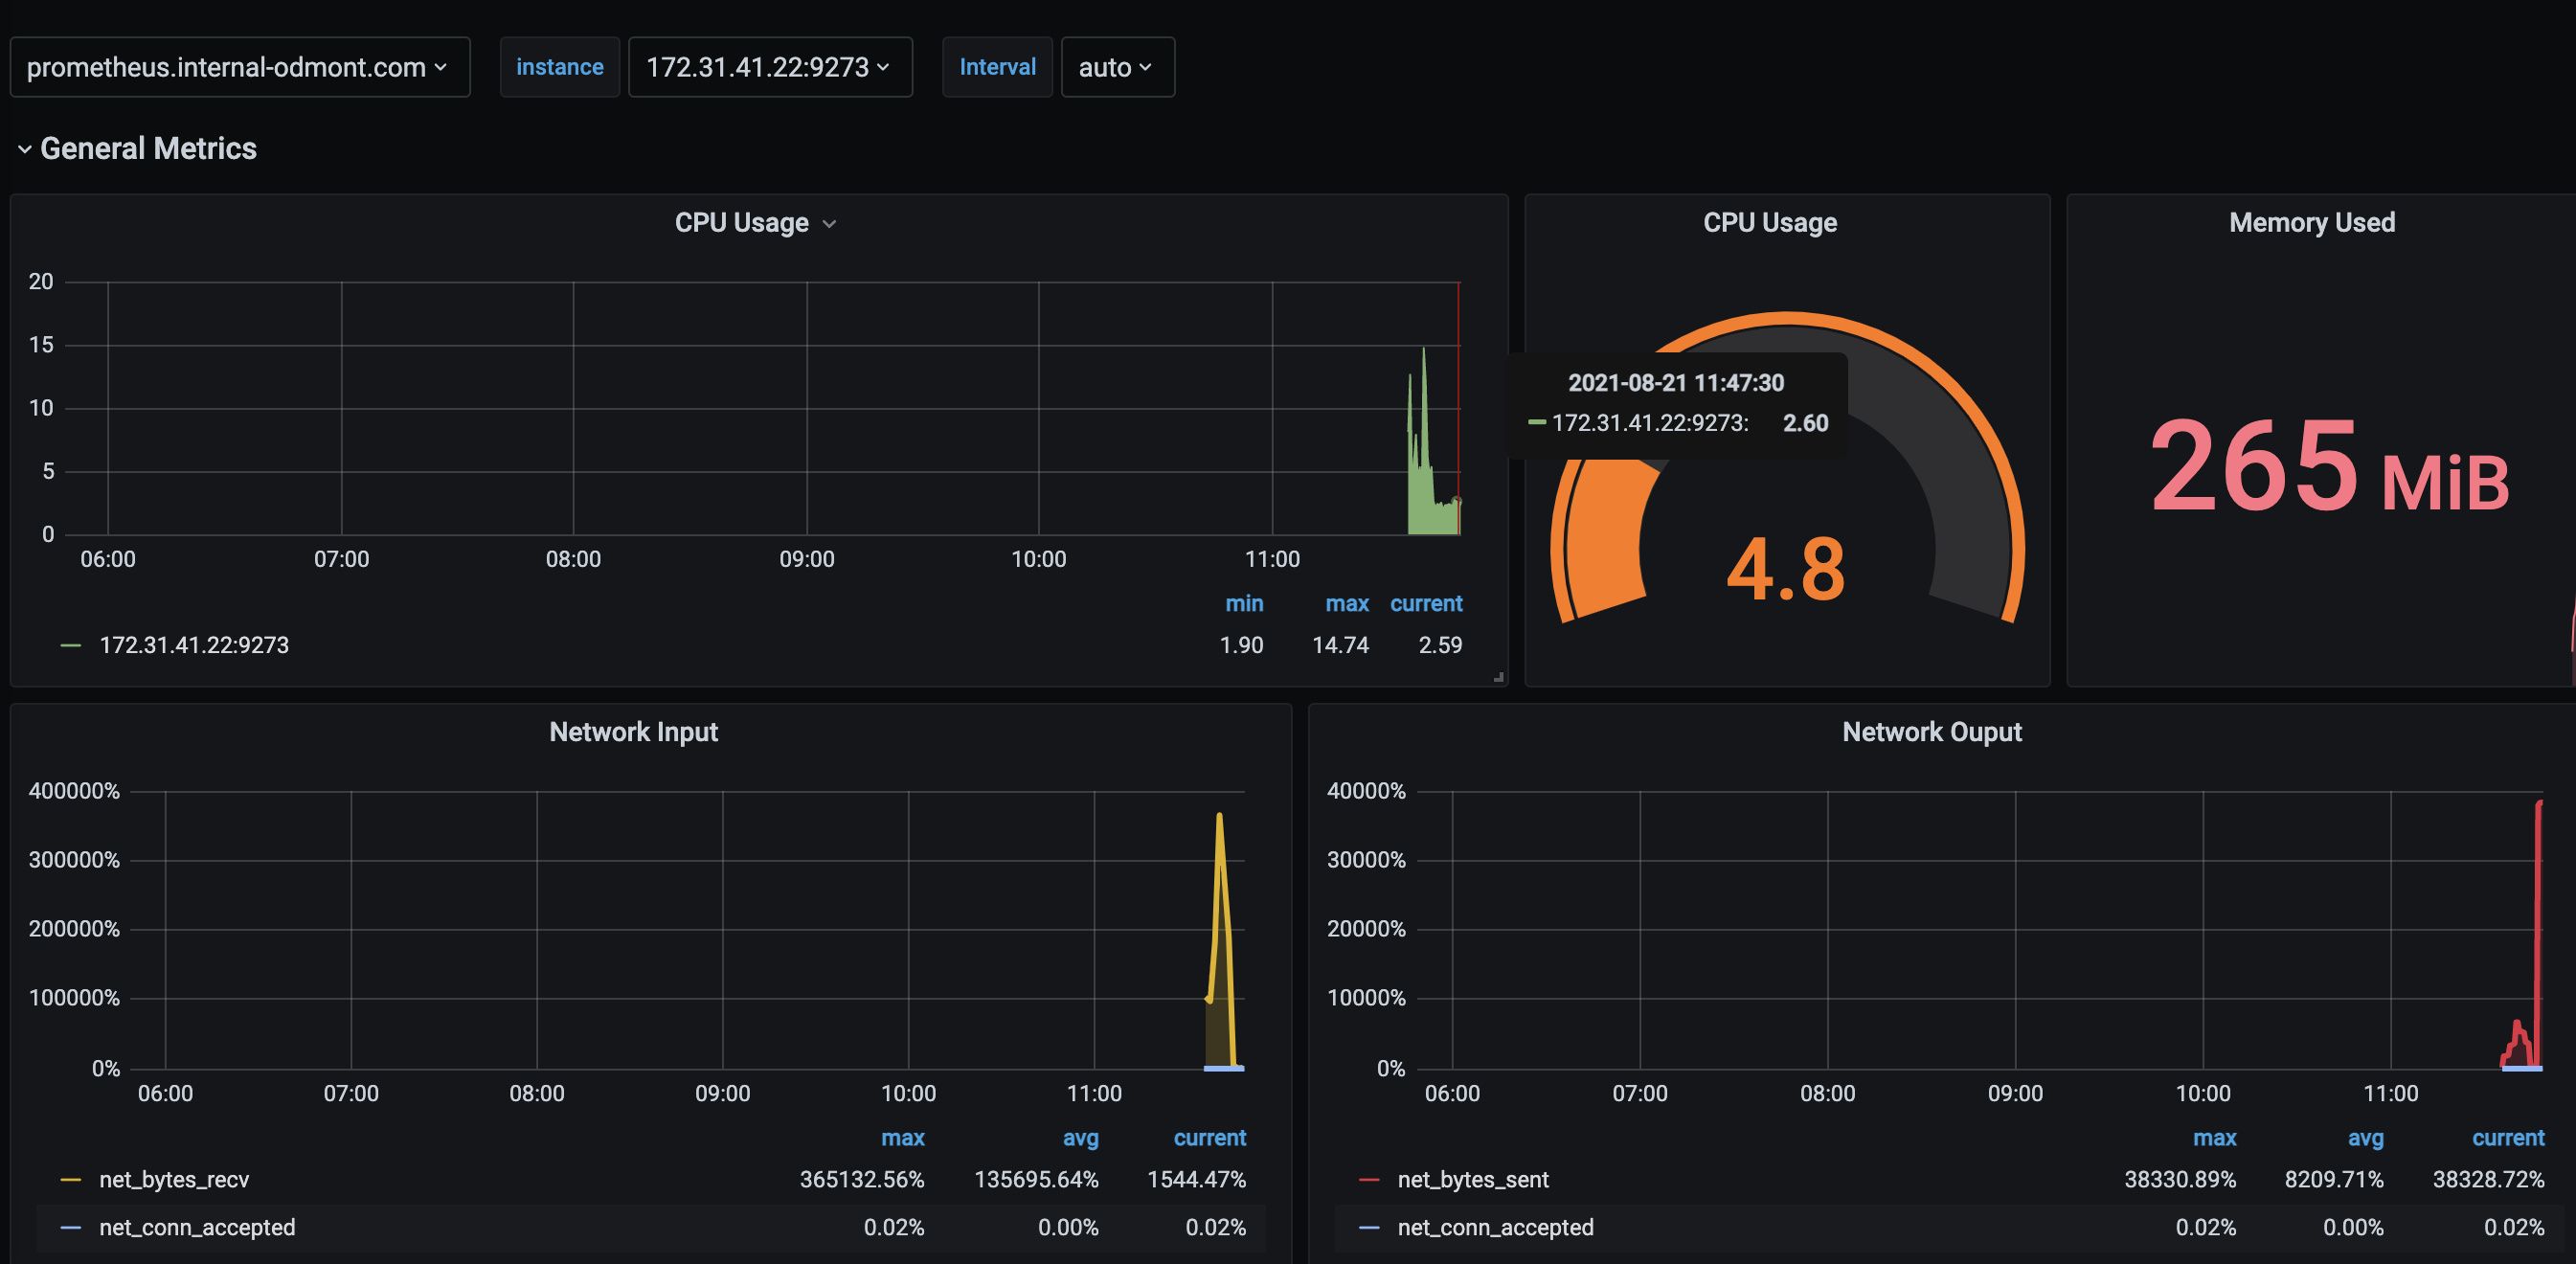
Dashboard for Nginx Web Server.
Dependencies
- Change the permission of the log file. Usually access log file can be found at
/var/log/nginx/access/log. You can also find the path of the access log file in nginx.conf(Nginx Configuration file) file. Provide the path in the tail plugin of Telegraf. - Enable the sub status module in Nginx, and add the following virtual host config in Nginx Web Server
server {
	listen 81 default_server;
	listen [::]:81 default_server;

	root /var/www/html;
	index index.html index.htm index.nginx-debian.html;

	server_name _;

	location / {
		try_files $uri $uri/ =404;
	}

	location /nginx_status {
        	stub_status;
        	allow 127.0.0.1;
        	deny all;
        }
}
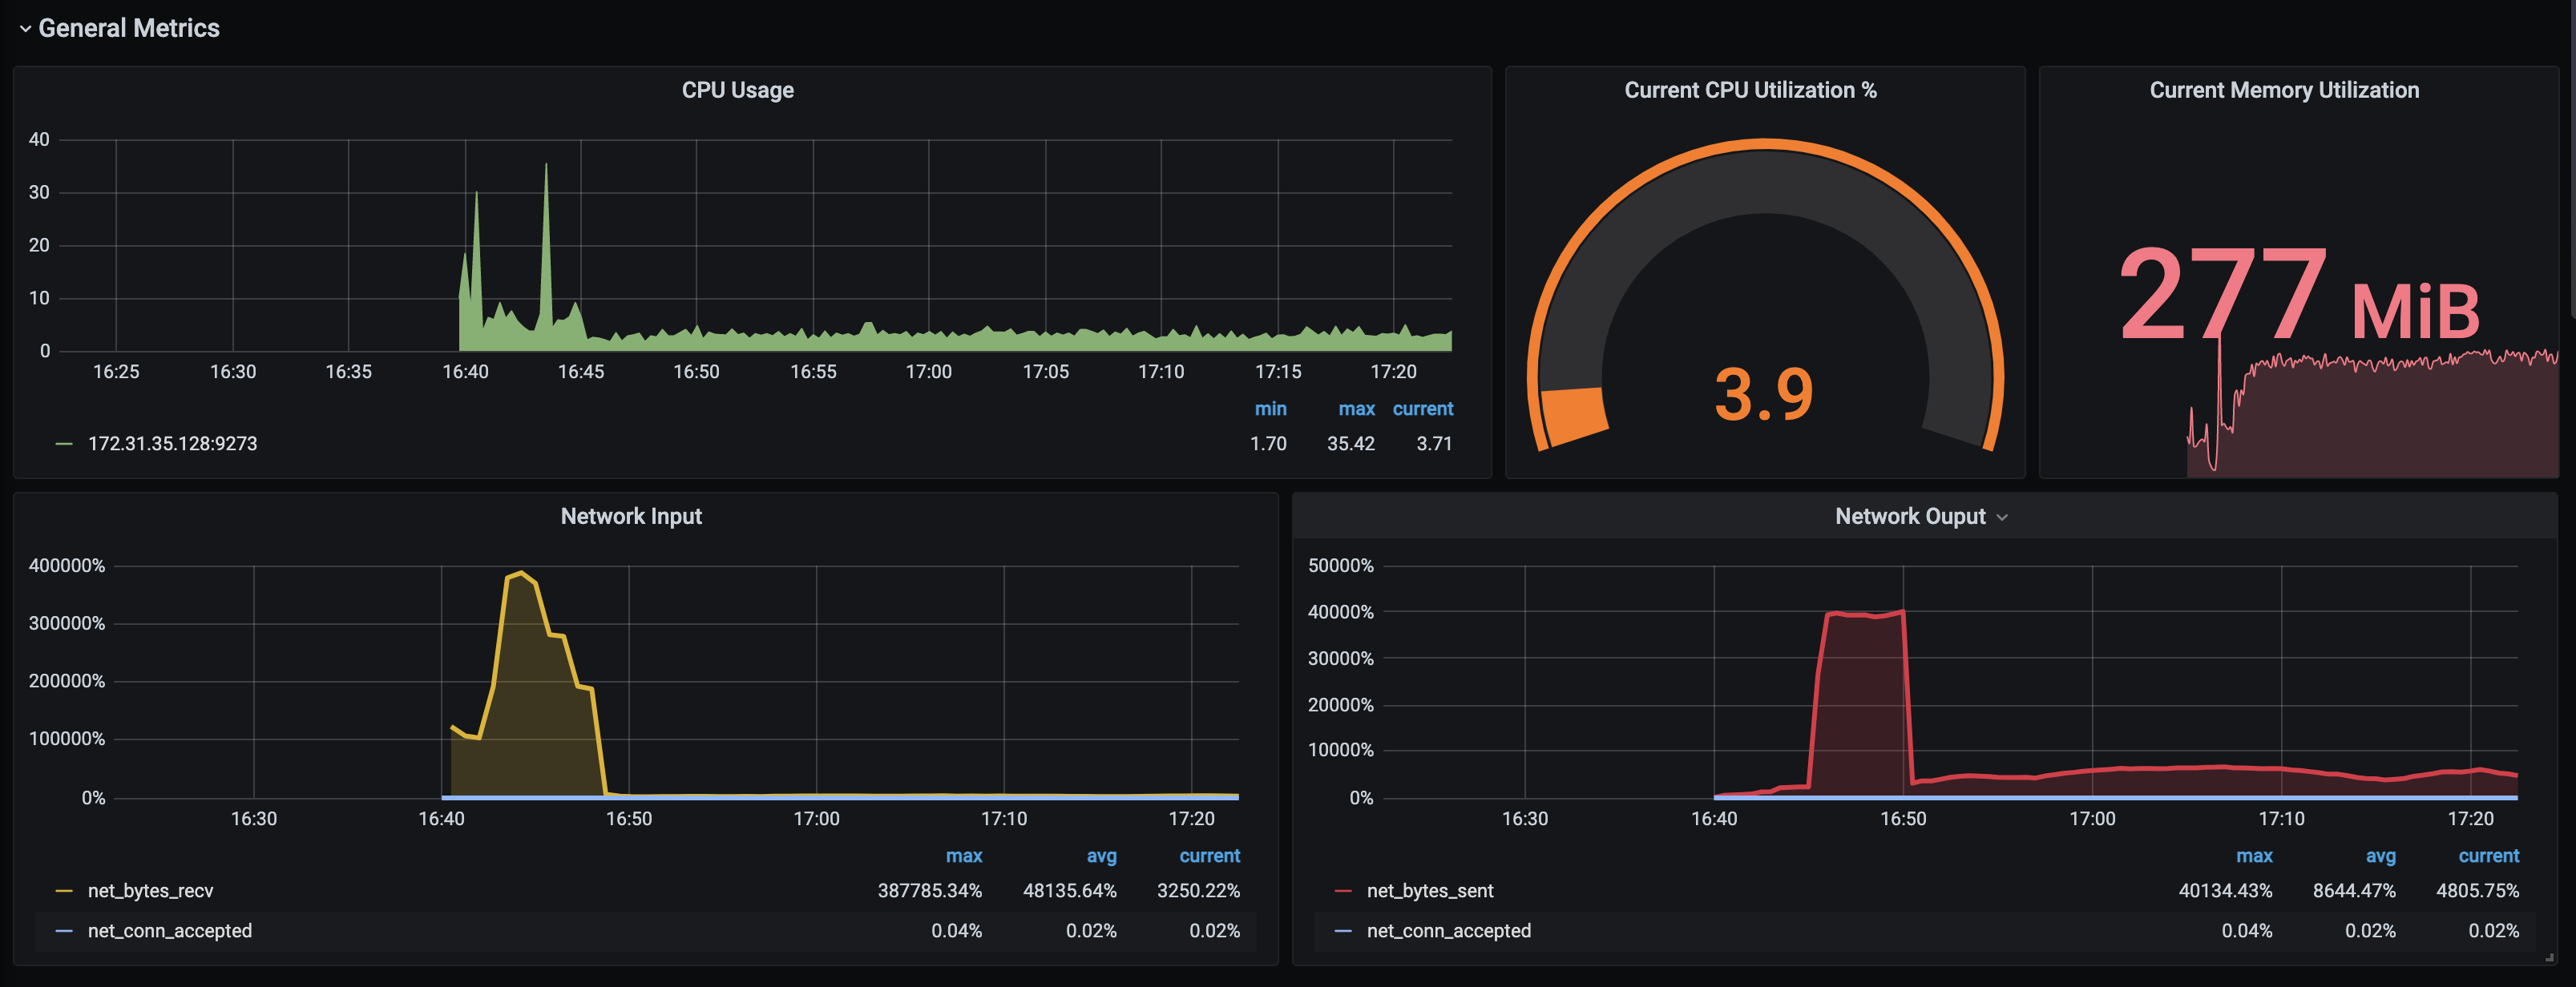
Following the metrics monitor through the dashboard
- CPU Usage
- Current CPU Utilization %
- Current Memory Utilization
- Network Input
- Network Ouput
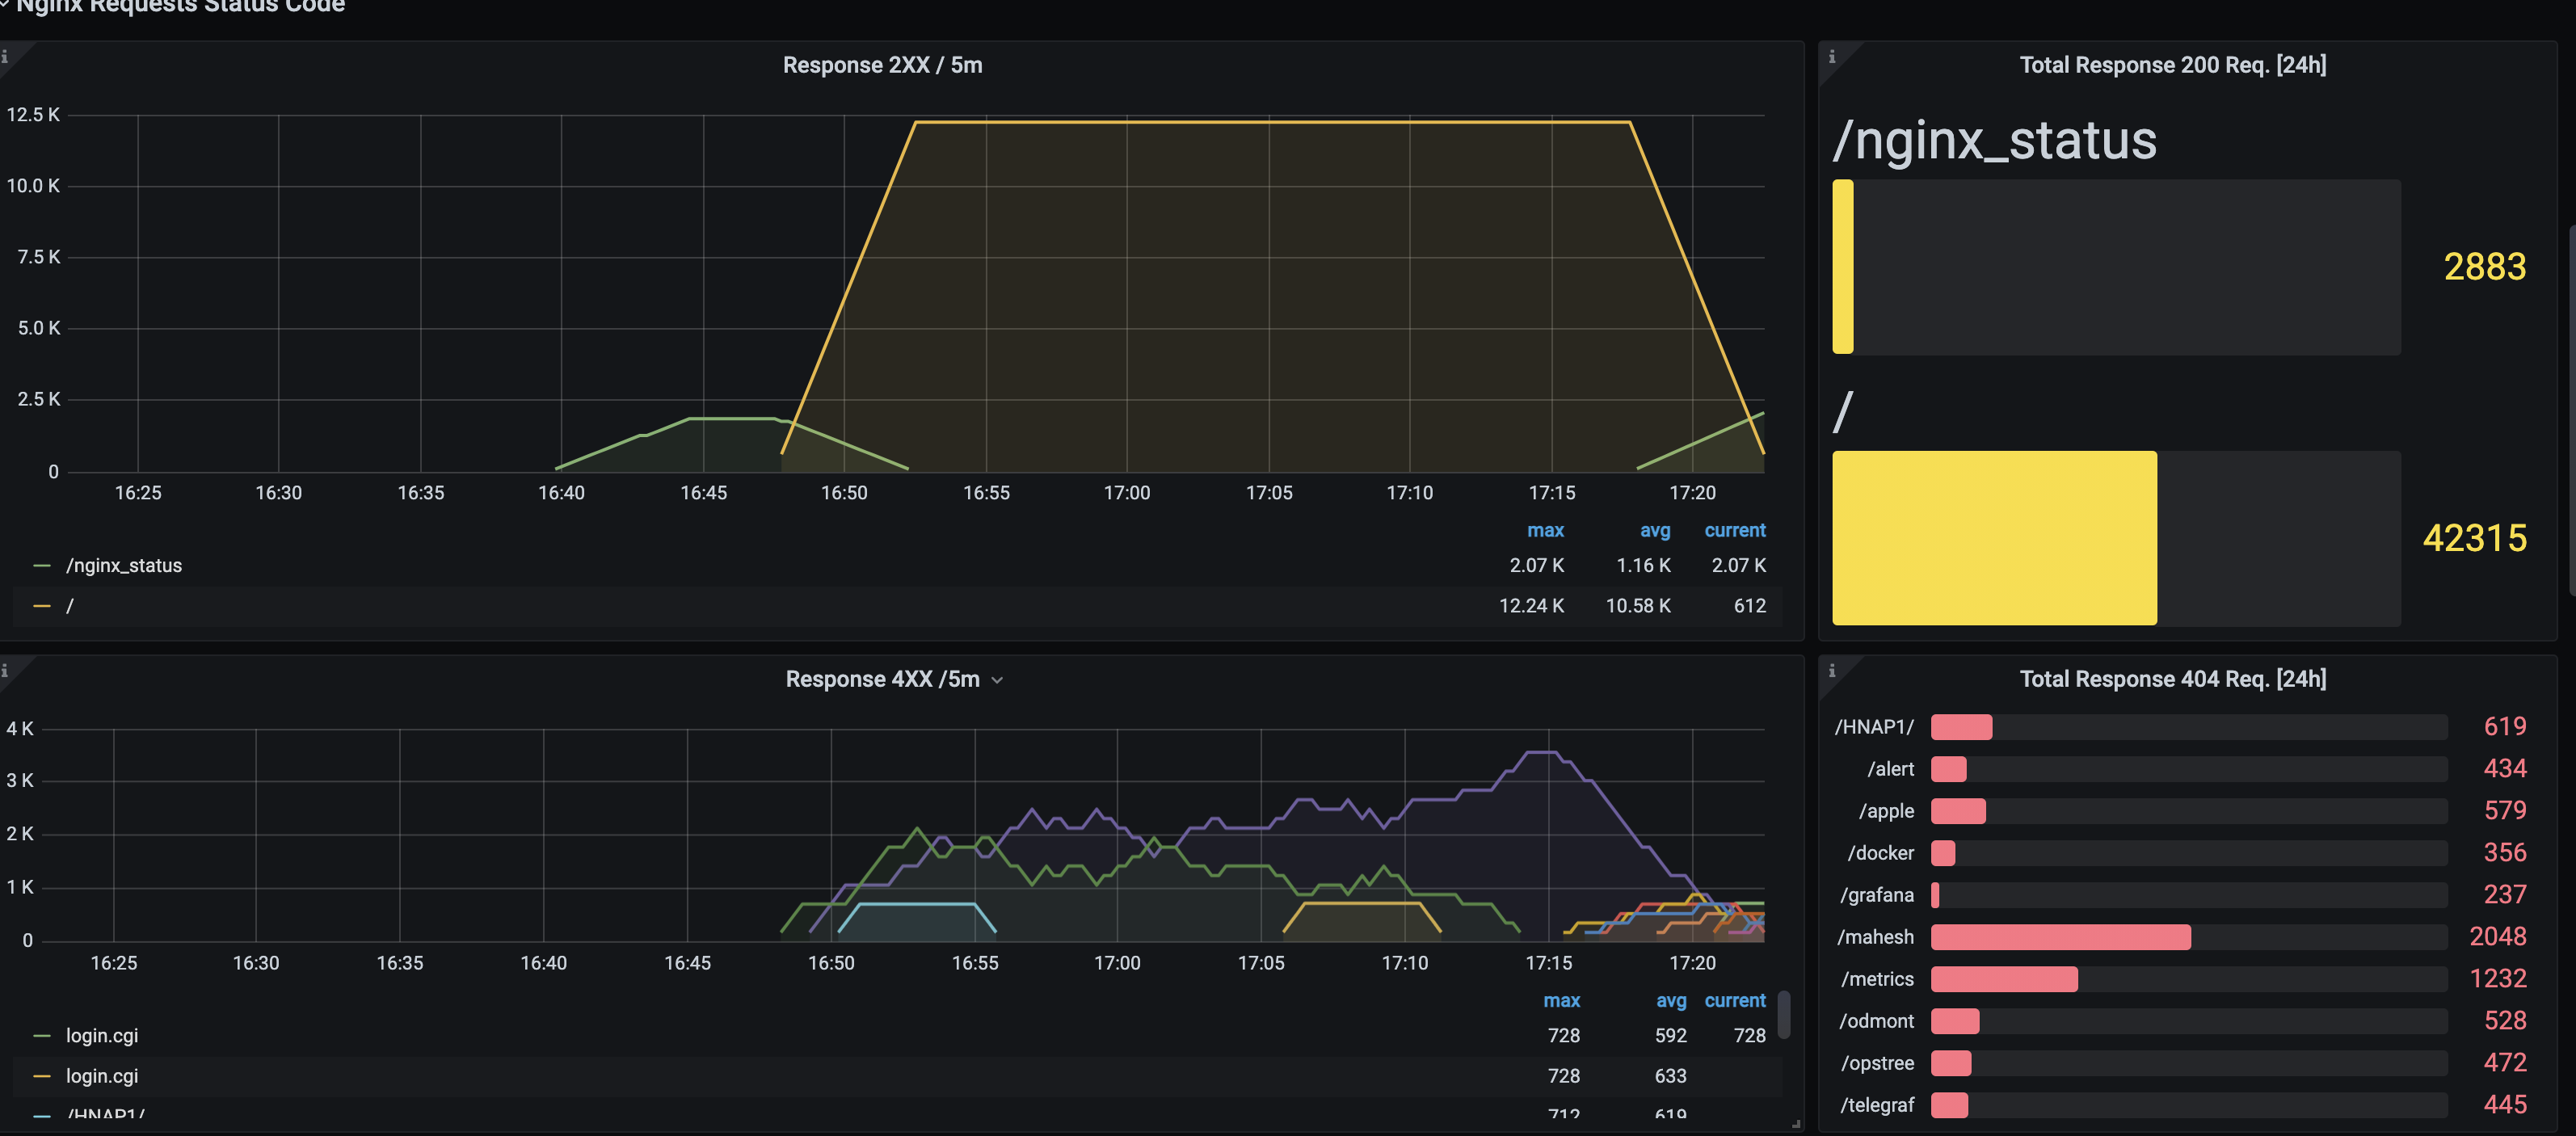
- Response 2XX / 5m
- Total Response 200 Req. [24h]
- Response 4XX /5m
- Total Response 404 Req. [24h]
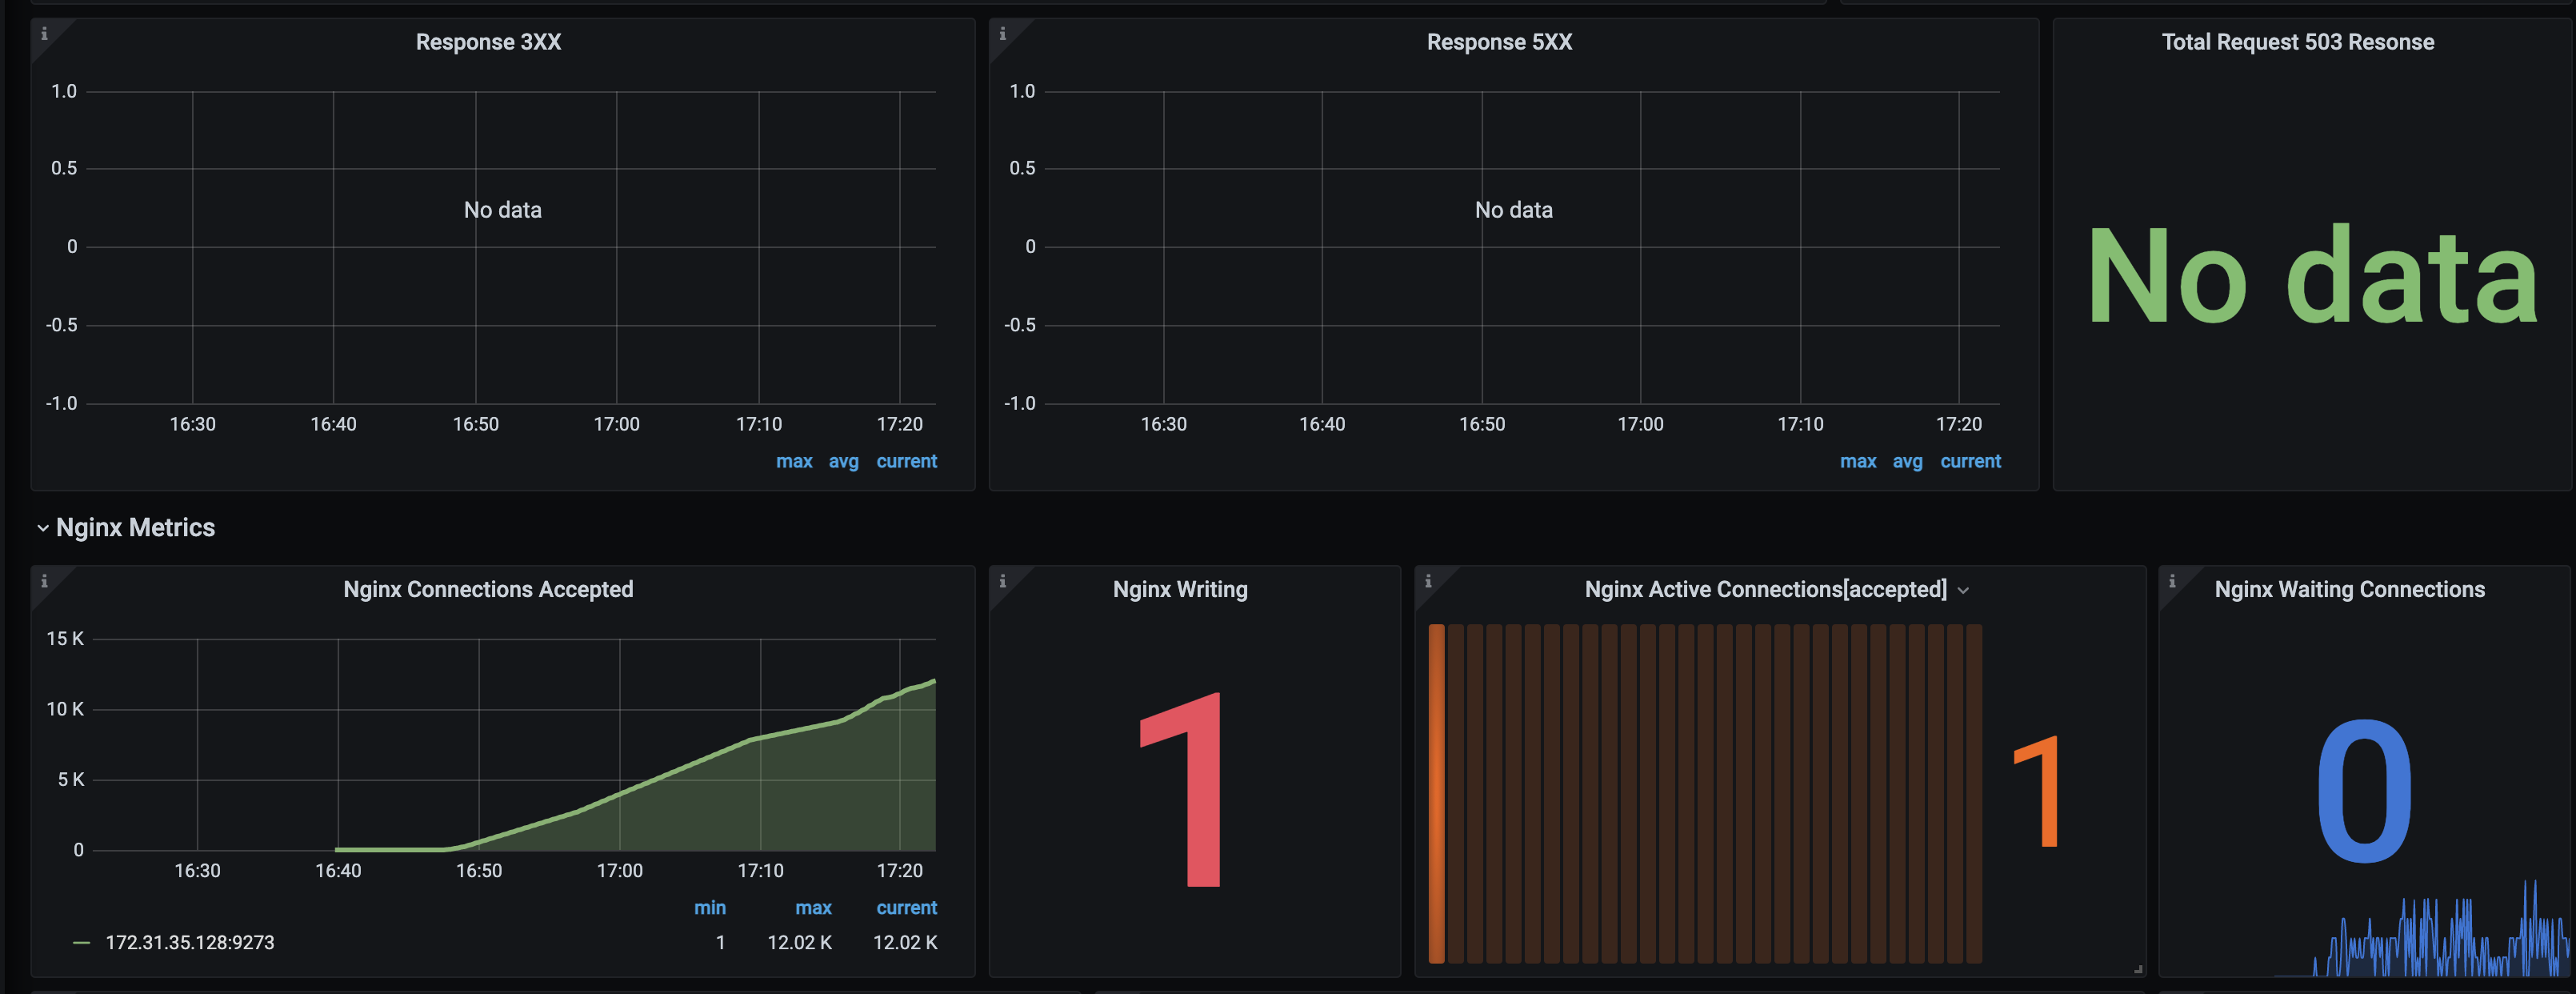
- Response 3XX
- Response 5XX
- Total Request 503 Resonse
- Nginx Connections Accepted
- Nginx Writing
- Nginx Active Connections[accepted]
- Nginx Waiting Connections
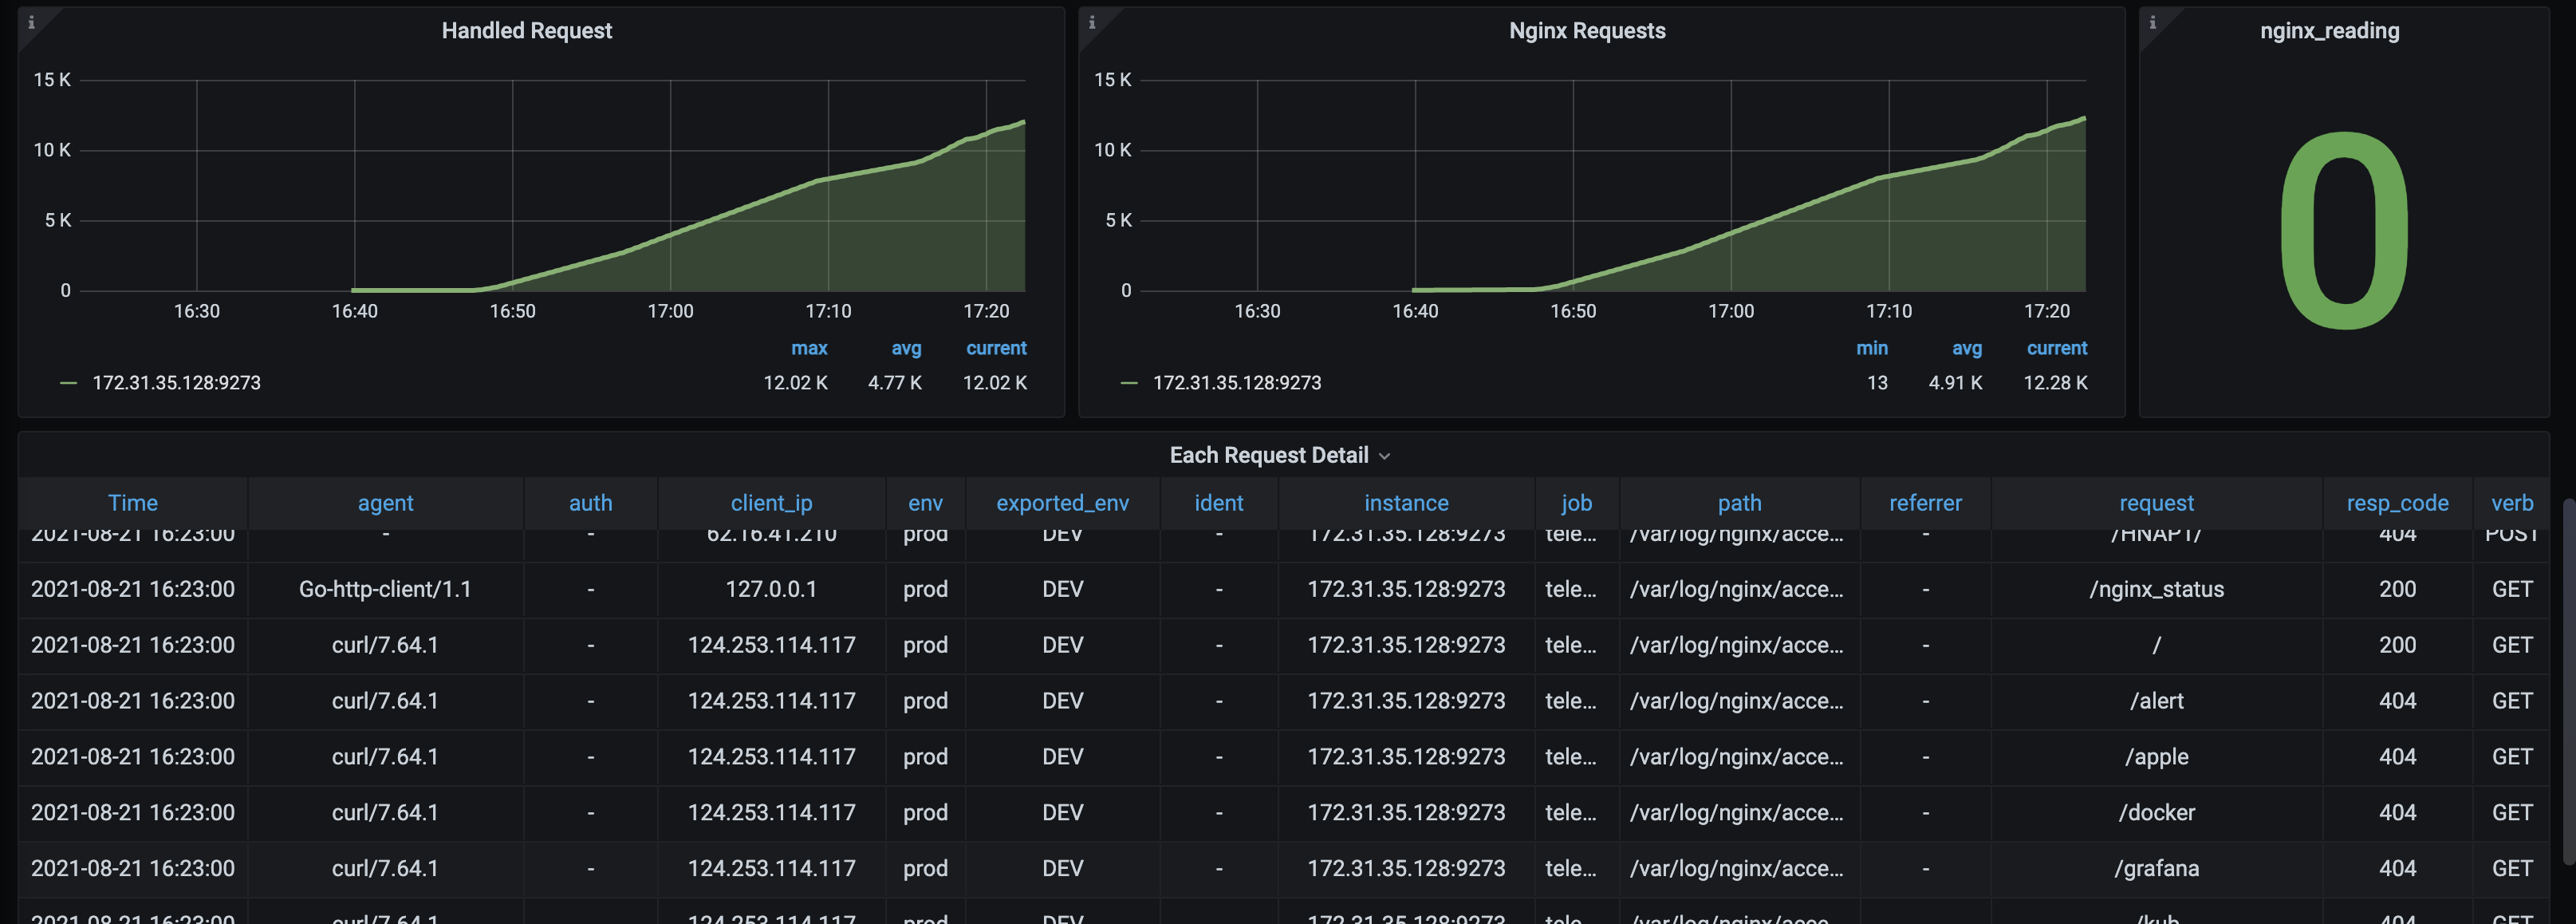
- Handled Request
- Nginx Requests
- nginx_reading
- Each Request Detail
Contributor Information
Export Dashboard✕
Download
Copy to Clipboard
Used Metrics 1313
cpu_usage_idle
mem_used
net_bytes_recv
-
net_conntrack_listener_conn_accepted_total
net_bytes_sent
nginxlog_resp_bytes
nginx_accepts
nginx_writing
nginx_active
nginx_waiting
nginx_handled
nginx_requests
nginx_reading