POD - k8s-monitor 1,4511,451 5.0 (1 reviews)
7/21/2021
7/23/2021
1
Docker
>=7.5.0
Prometheus
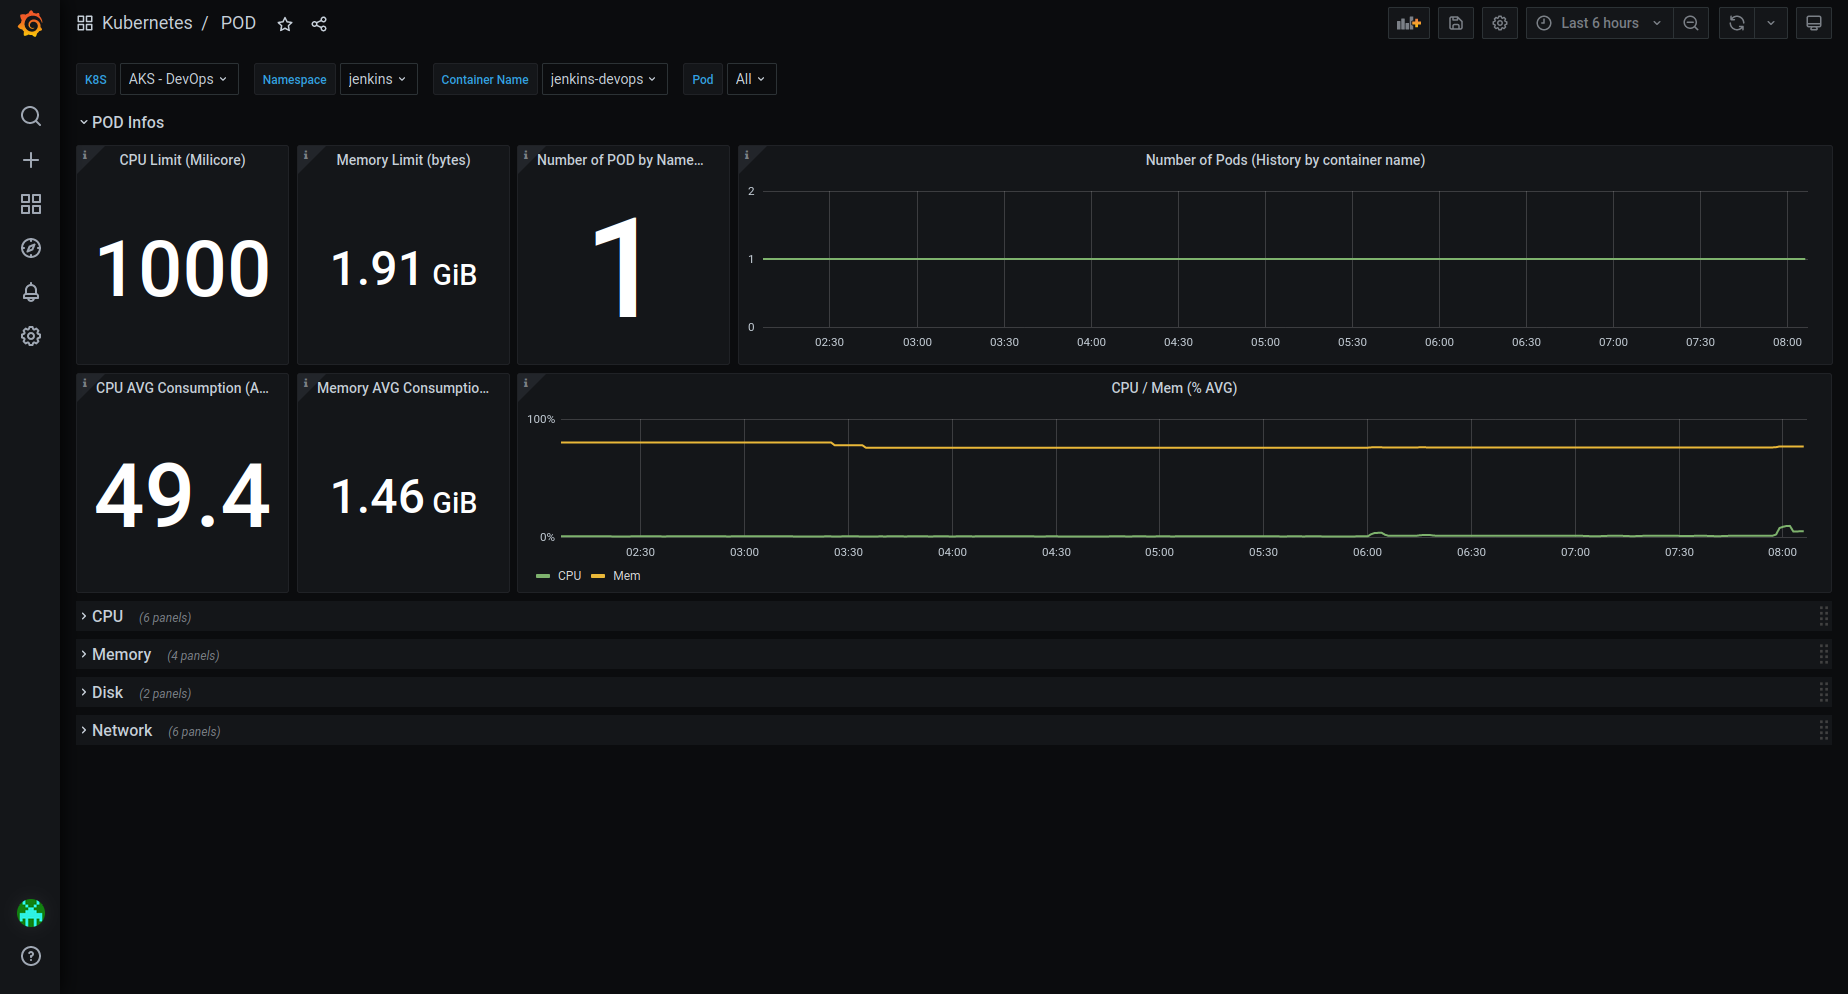
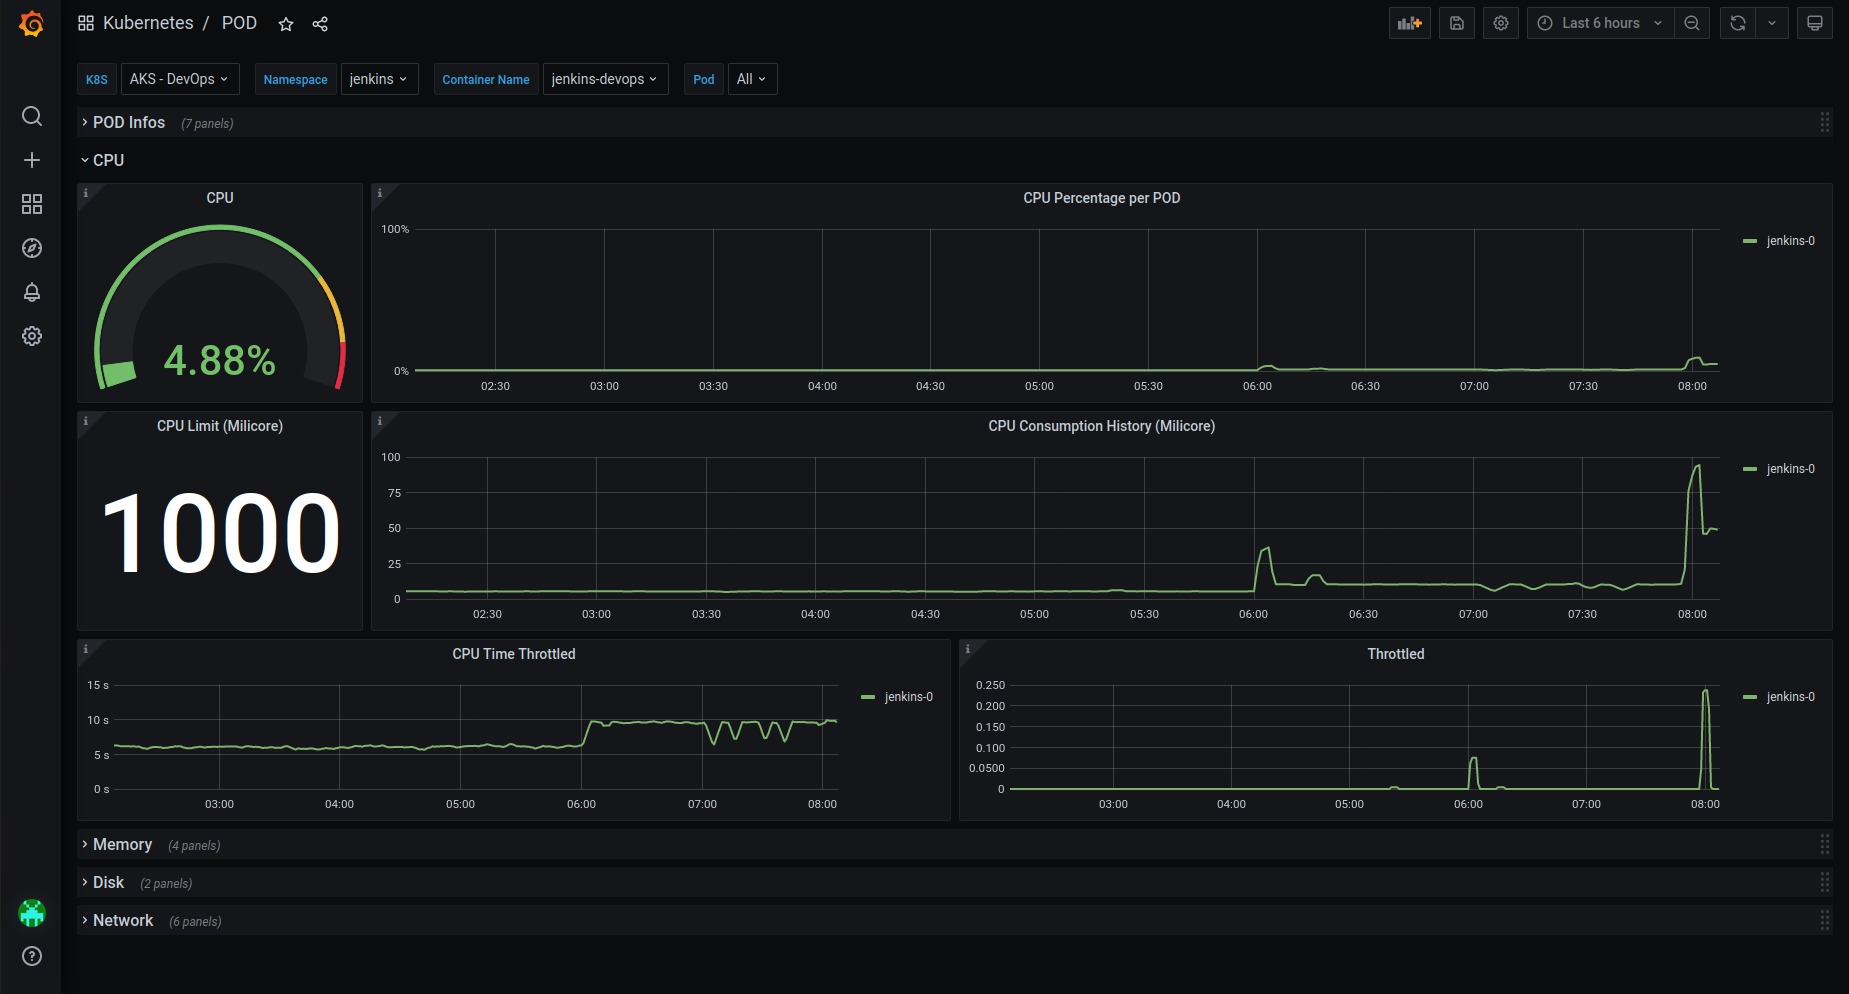
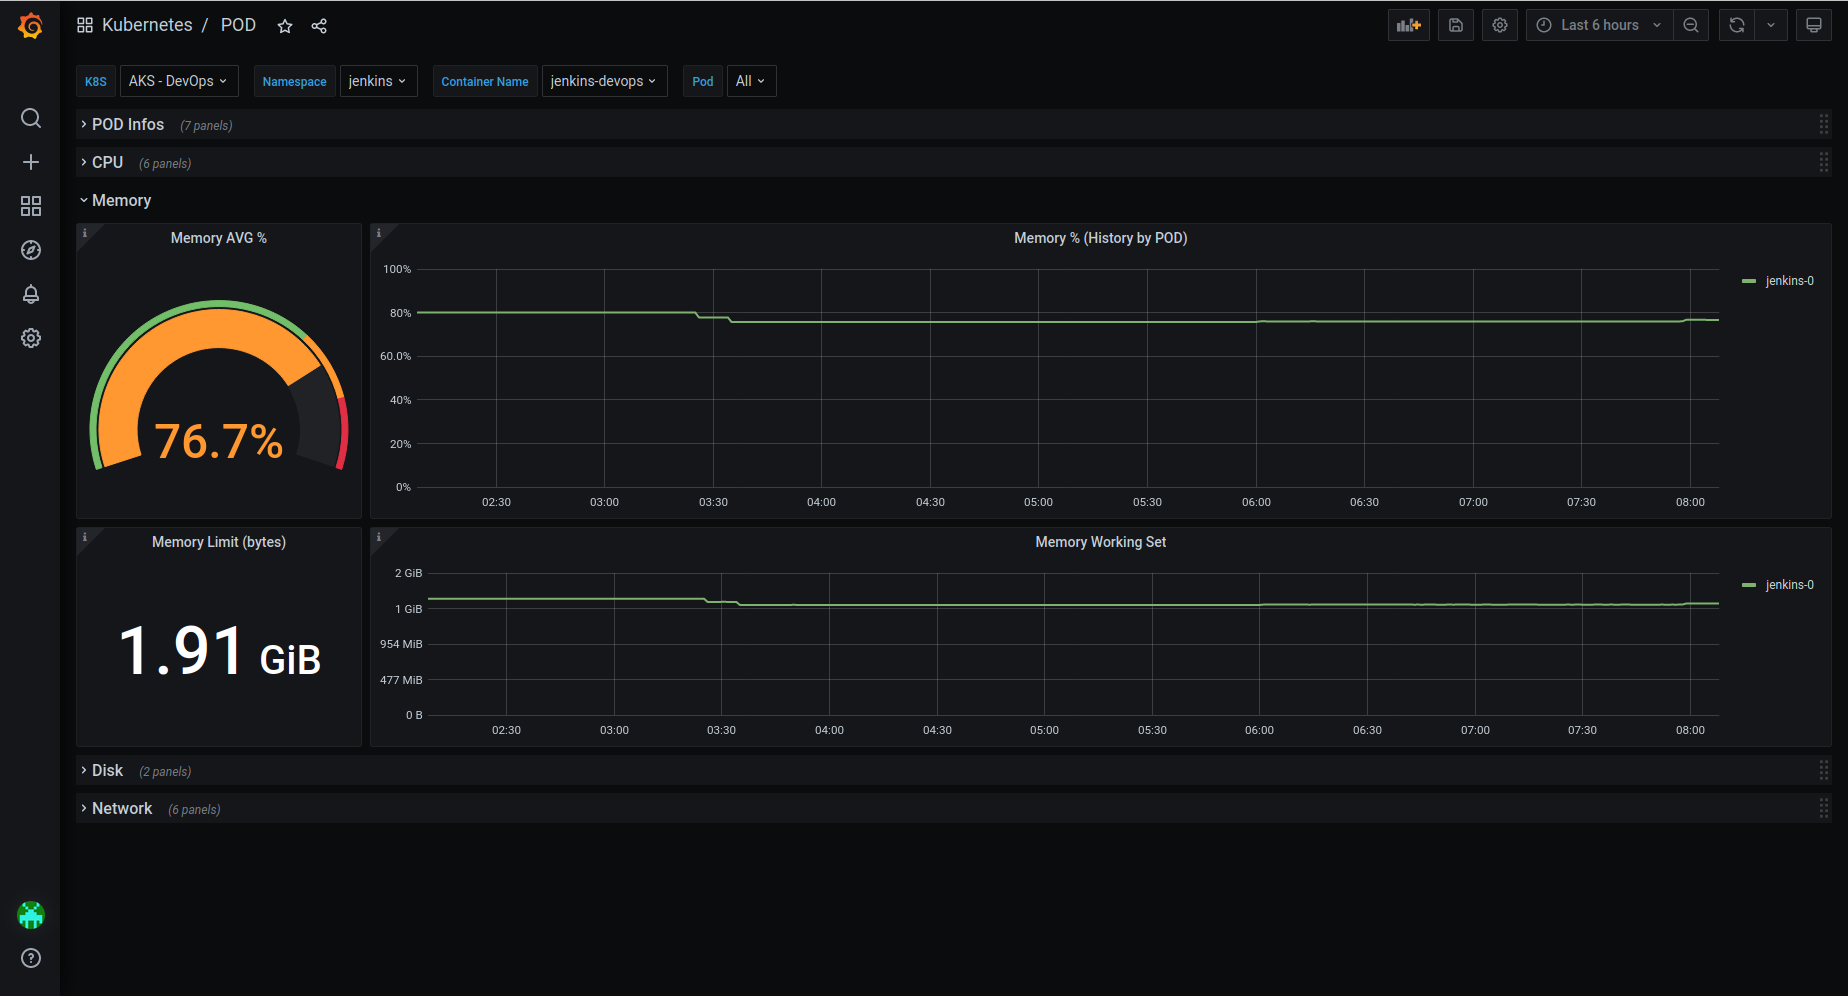
POD - k8s-monitor
Overview
POD - k8s-monitor was develop to show metrics from Cadvisor inside k8s-monitor system. This dashboard is ready for accept more than 1 cluster datasource, you just need add multiples datasources with prefix "K8S - ".
How to use
1 - You need install k8s-monitor in your Kubernetes cluster.
2 - Configure a new datasource to prometheus service and setting the name with prefix "K8S - ". If your Grafana is in the same namespace as k8s-monitor, the datasource URL will be http://prometheus-k8s-service:9090.
Please, visit k8s-monitor to get more information and setup guide.
Export Dashboard✕
Download
Copy to Clipboard