Redis Clusters via redis_exporter 3.0 10,33810,338
6/23/2021
6/23/2021
1
>=7.2.1
Prometheus
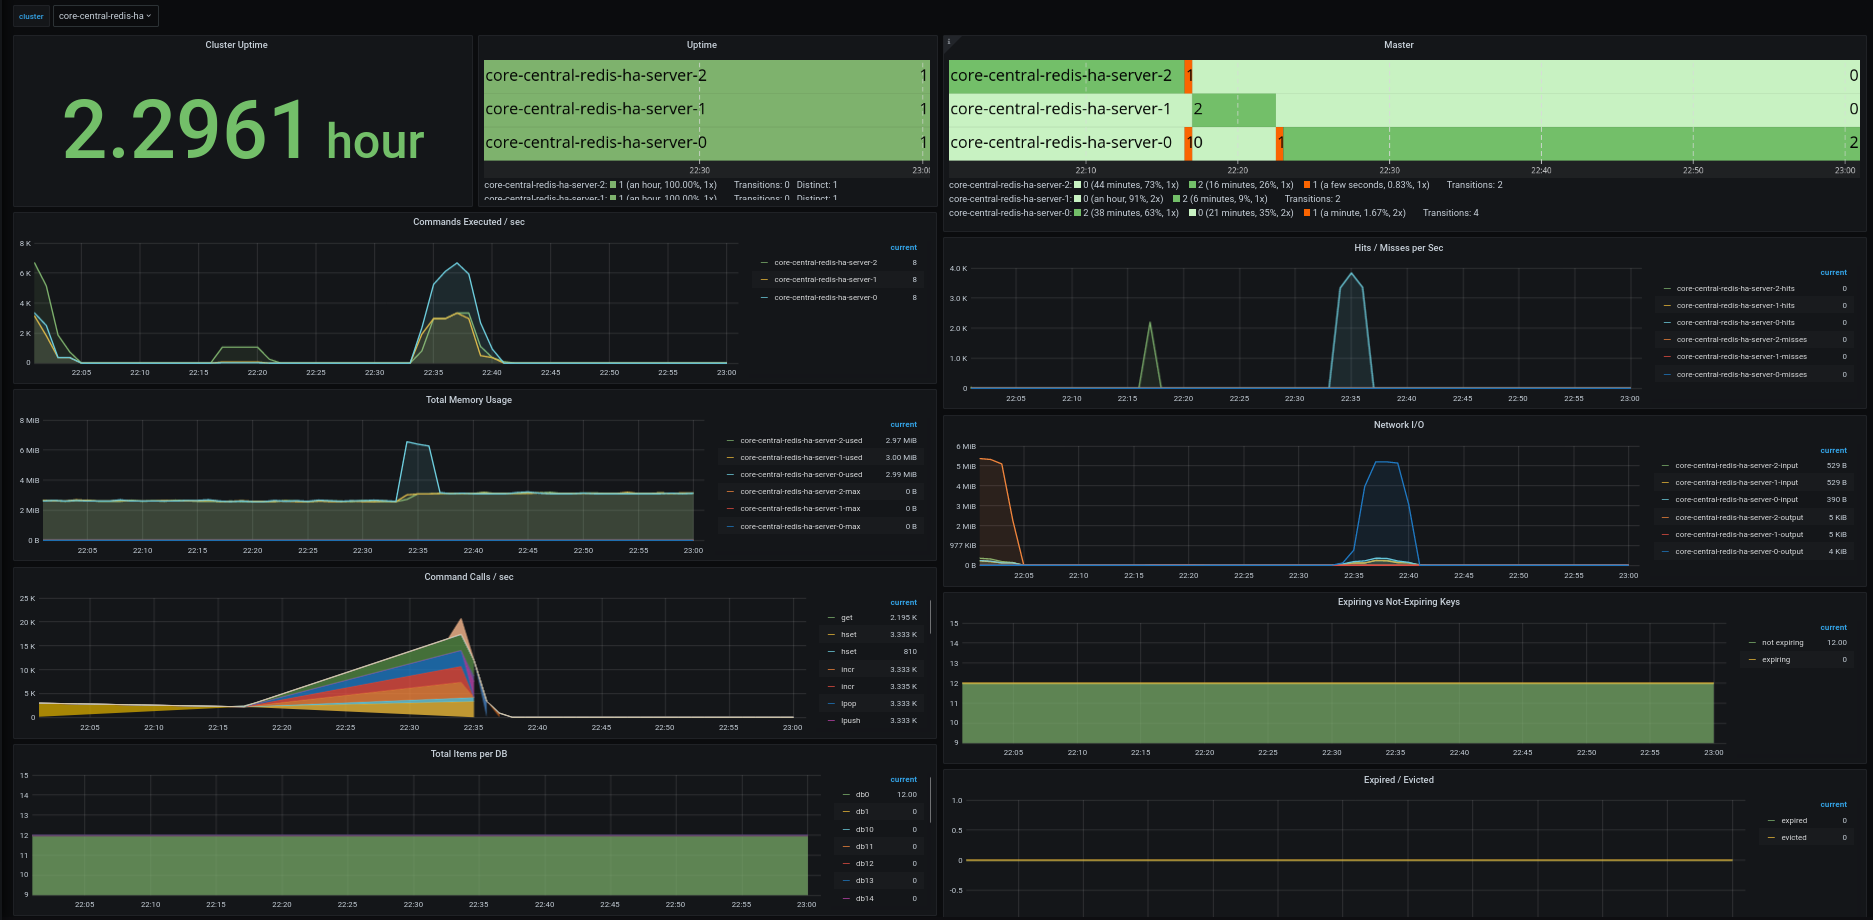
Grafana Dashboard for Prometheus/Thanos metrics populated via the redis_exporter. Redis clusters in the screenshot were installed via the redis-ha chart (https://github.com/DandyDeveloper/charts)
Improvement over https://grafana.com/grafana/dashboards/763 and https://grafana.com/grafana/dashboards/4074 by using name of the redis cluster instead (via the job label on prometheus)
Export Dashboard✕
Download
Copy to Clipboard
Used Metrics 1616
-
redis_uptime_in_seconds
-
redis_up
-
redis_connected_slaves
-
redis_commands_processed_total
-
redis_keyspace_hits_total
-
redis_keyspace_misses_total
-
redis_memory_used_bytes
-
redis_config_maxmemory
-
redis_net_input_bytes_total
-
redis_net_output_bytes_total
topk
-
redis_commands_total
-
redis_db_keys
-
redis_db_keys_expiring
-
redis_expired_keys_total
-
redis_evicted_keys_total