ArgoCD 51,037,39651,037,396
6/14/2021
6/14/2021
1
>=8.0.0
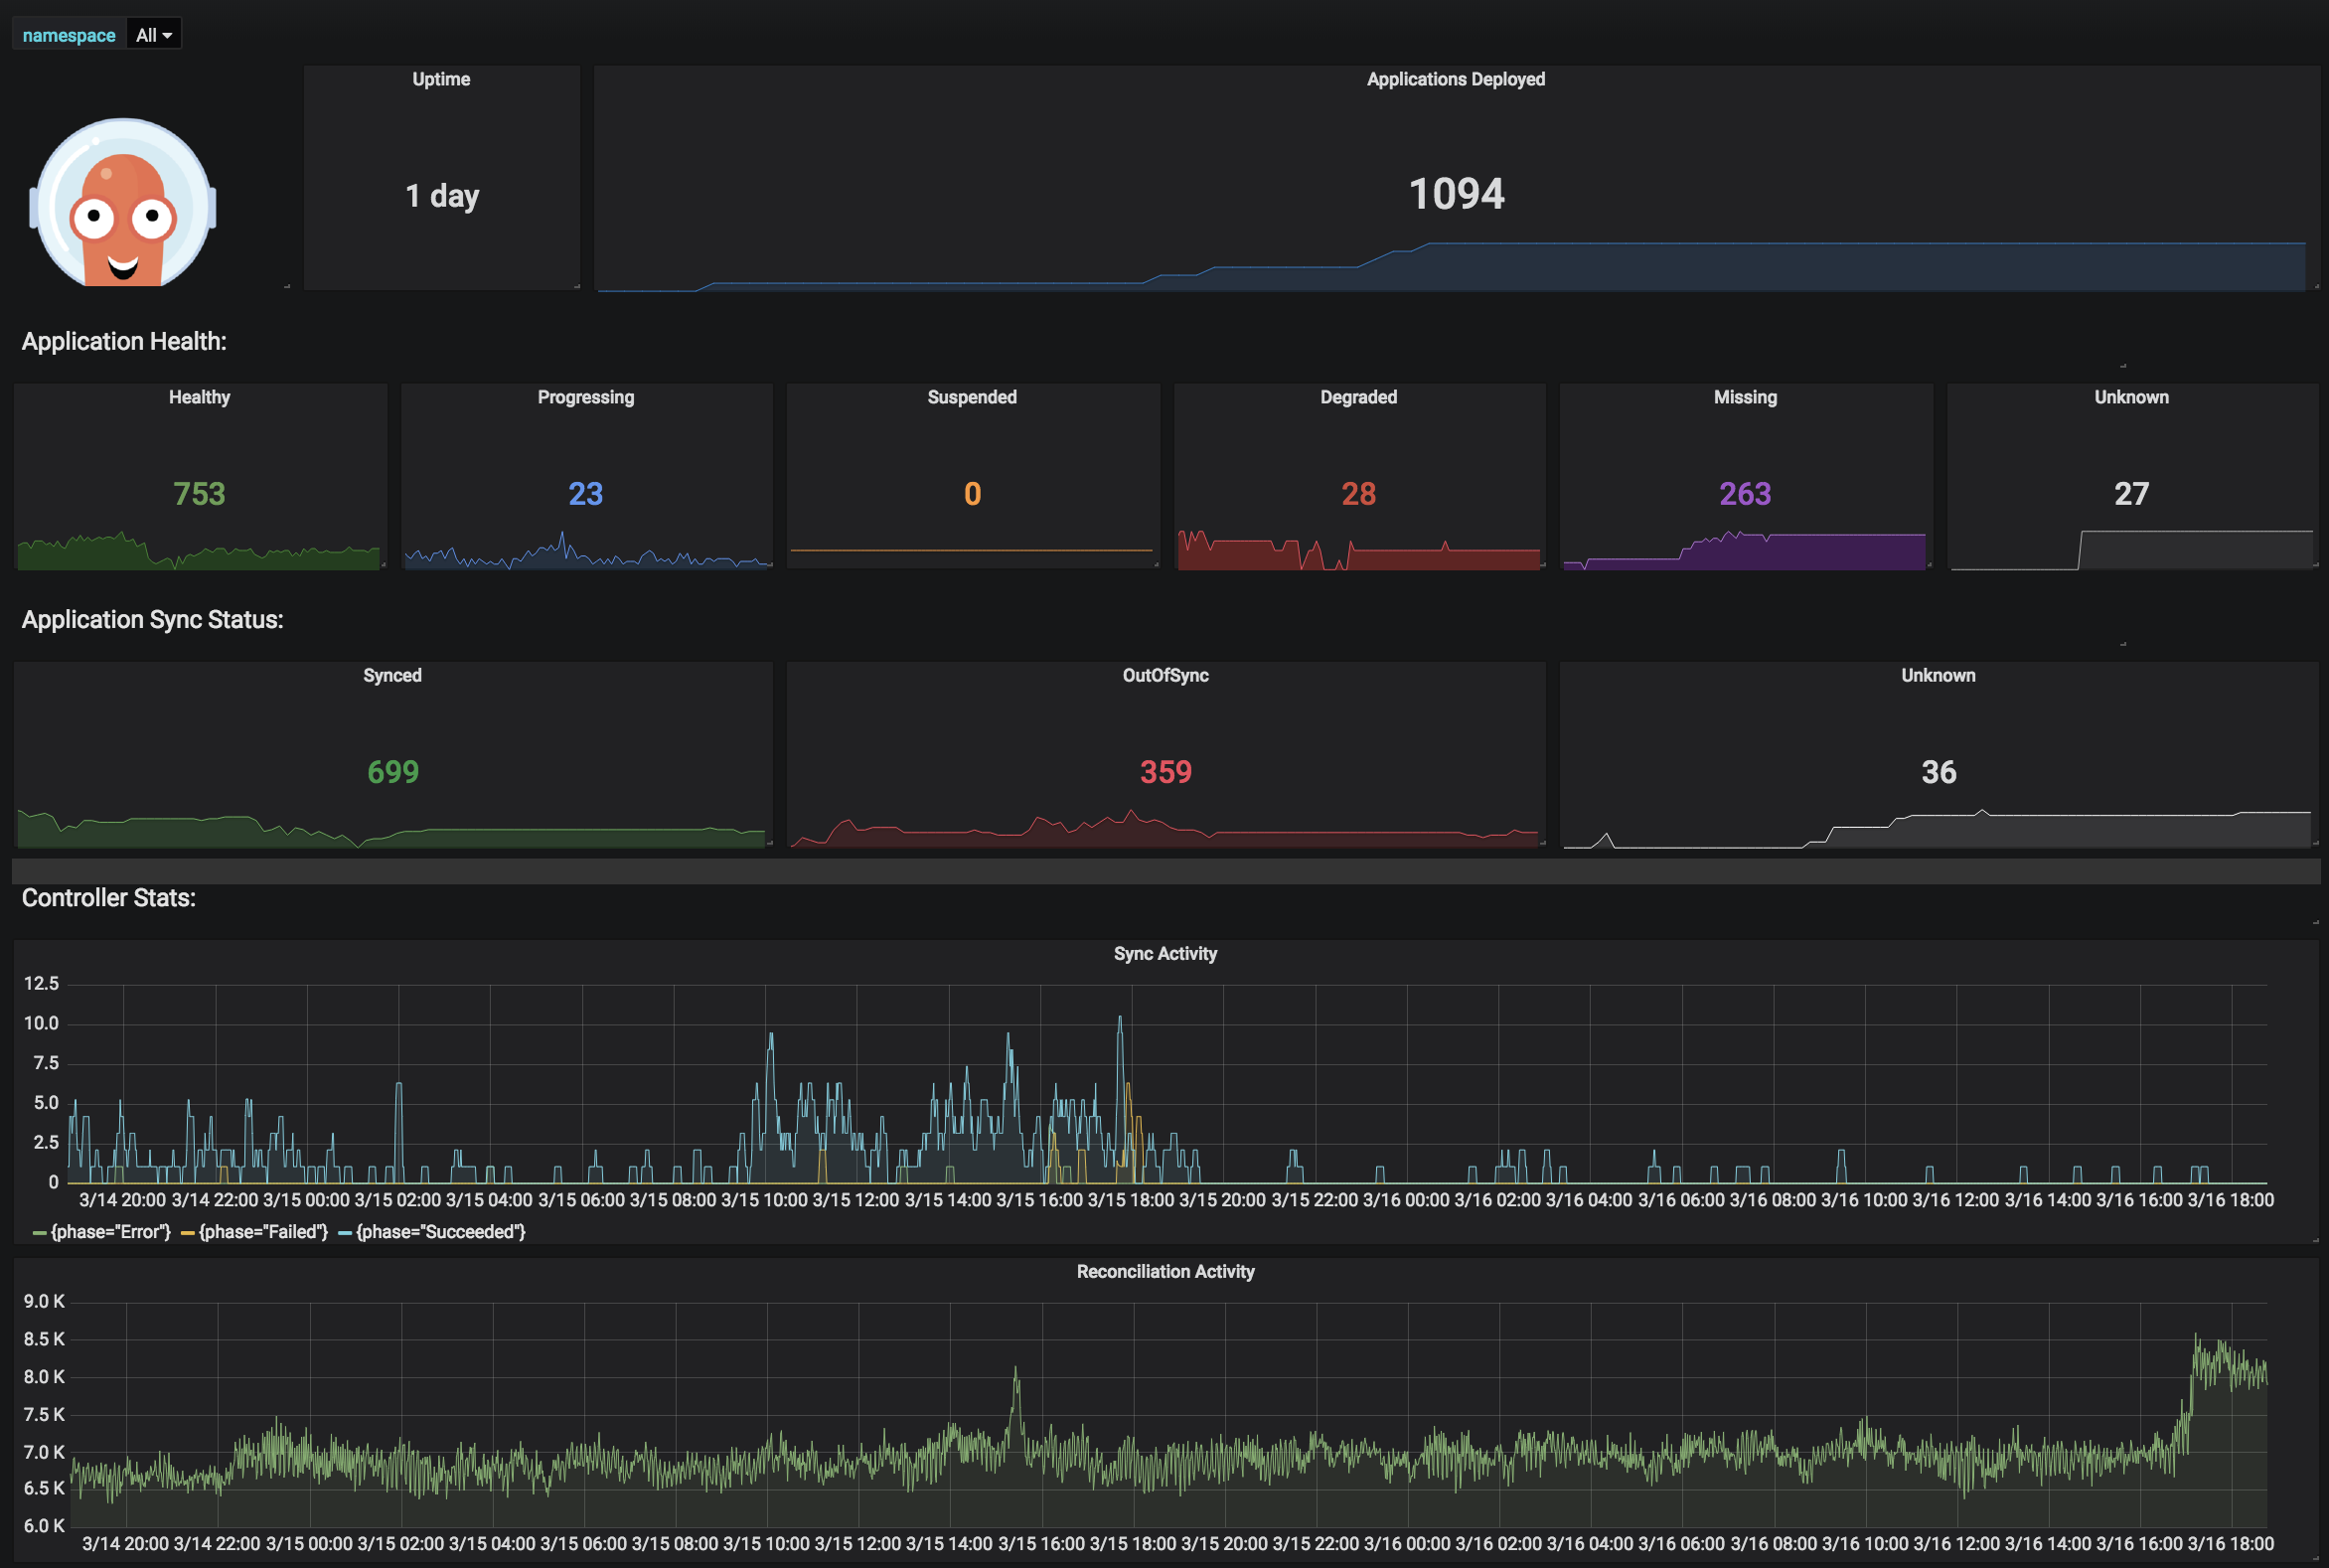
This is the dashboard from https://github.com/argoproj/argo-cd/blob/master/examples/dashboard.json
It's imported in Grafana 8 and then exported again with the Export for sharing externally flag enabled to make it possible to upload it to Grafana.com
Also refer to https://argo-cd.readthedocs.io/en/stable/operator-manual/metrics/
Export Dashboard✕
Download
Copy to Clipboard
Used Metrics 33
-
process_start_time_seconds
argocd_cluster_info
argocd_app_info