JVM metrics 3,7903,790
Based on https://grafana.com/grafana/dashboards/8563
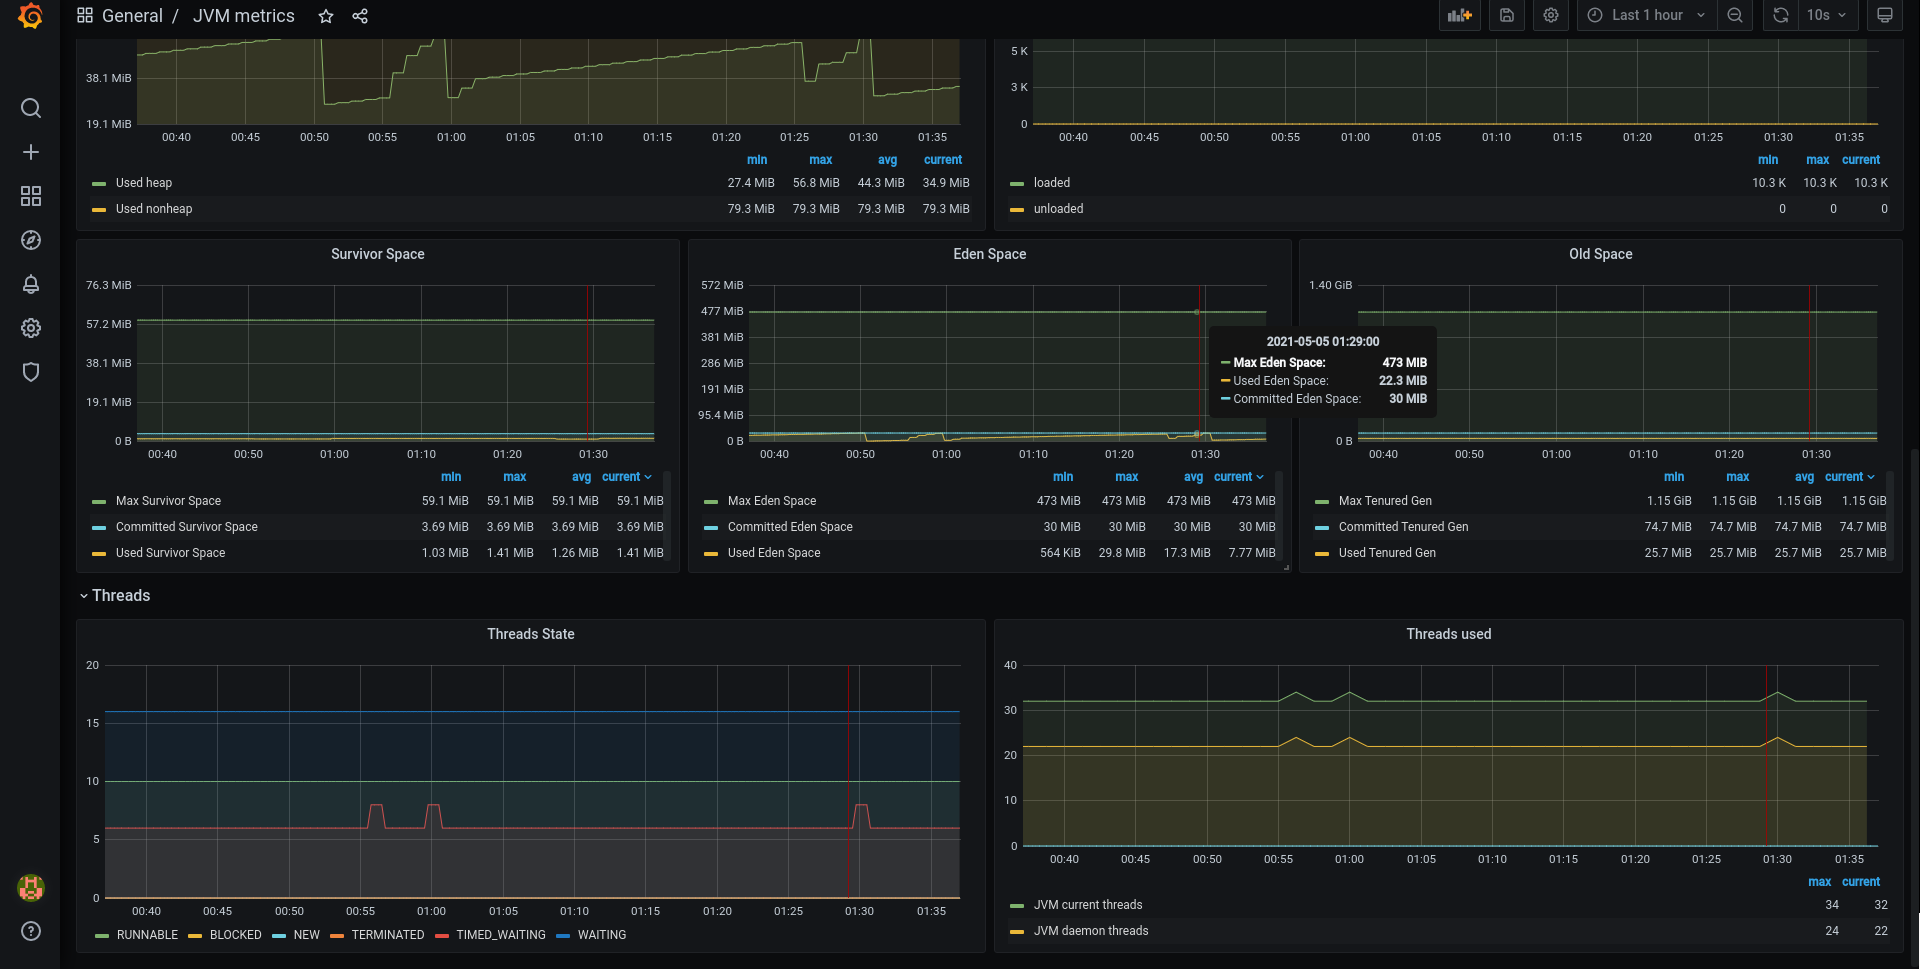
Shows JVM metrics for memory, classes, threads etc.. Uses metrics published by default JMX exporter.
Shows only JVM information, without dependencies on other exporters.
Uses default Prometheus tags names, as configured by https://github.com/prometheus-community/helm-charts
Revision one:
Fixed the label names according to https://github.com/prometheus-community/helm-charts/pull/1520
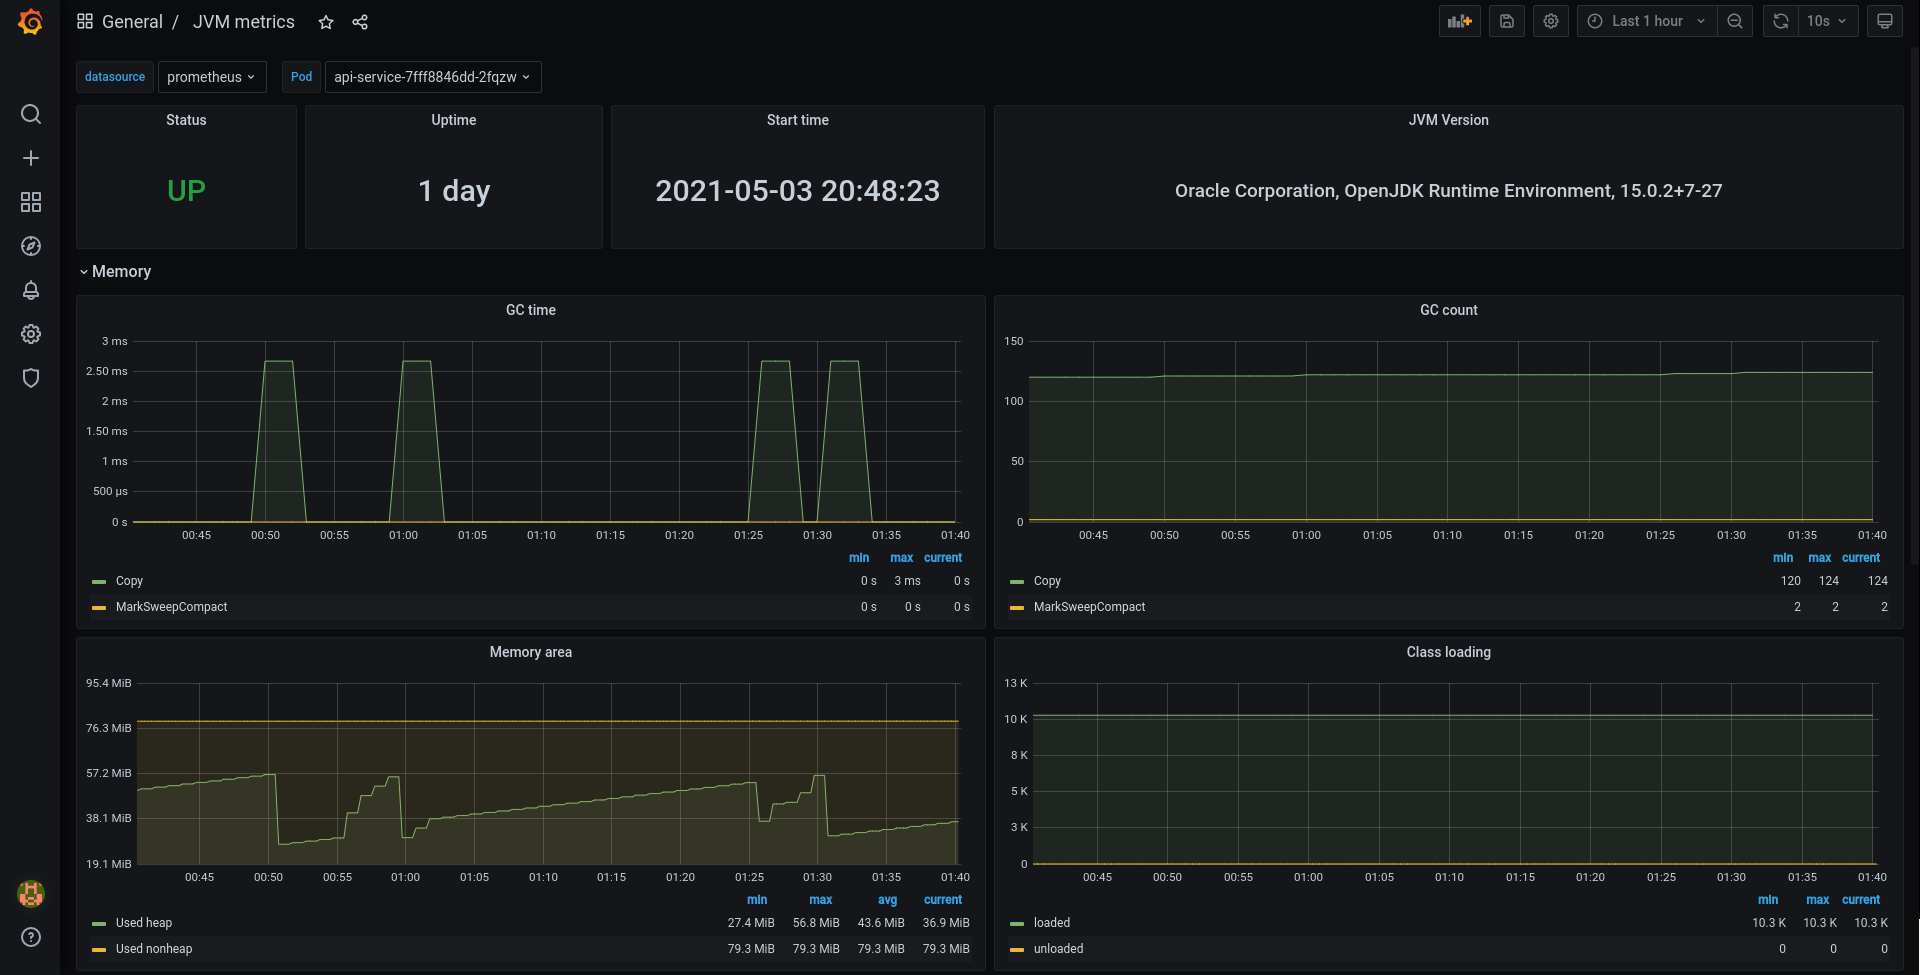
Used Metrics 1919
-
up
-
process_start_time_seconds
jvm_info
jdk
vendor
runtime
version
jvm_gc_collection_seconds_sum
jvm_gc_collection_seconds_count
jvm_memory_bytes_used
jvm_classes_loaded
jvm_classes_unloaded_total
jvm_memory_pool_bytes_max
jvm_memory_pool_bytes_used
jvm_memory_pool_bytes_committed
jvm_threads_state
jvm_threads_current
jvm_threads_daemon
jvm_threads_deadlocked