OSM Mesh and Envoy Details 2,4532,453
3/26/2021
3/15/2022
8
Azure
>=7.0.1
Prometheus
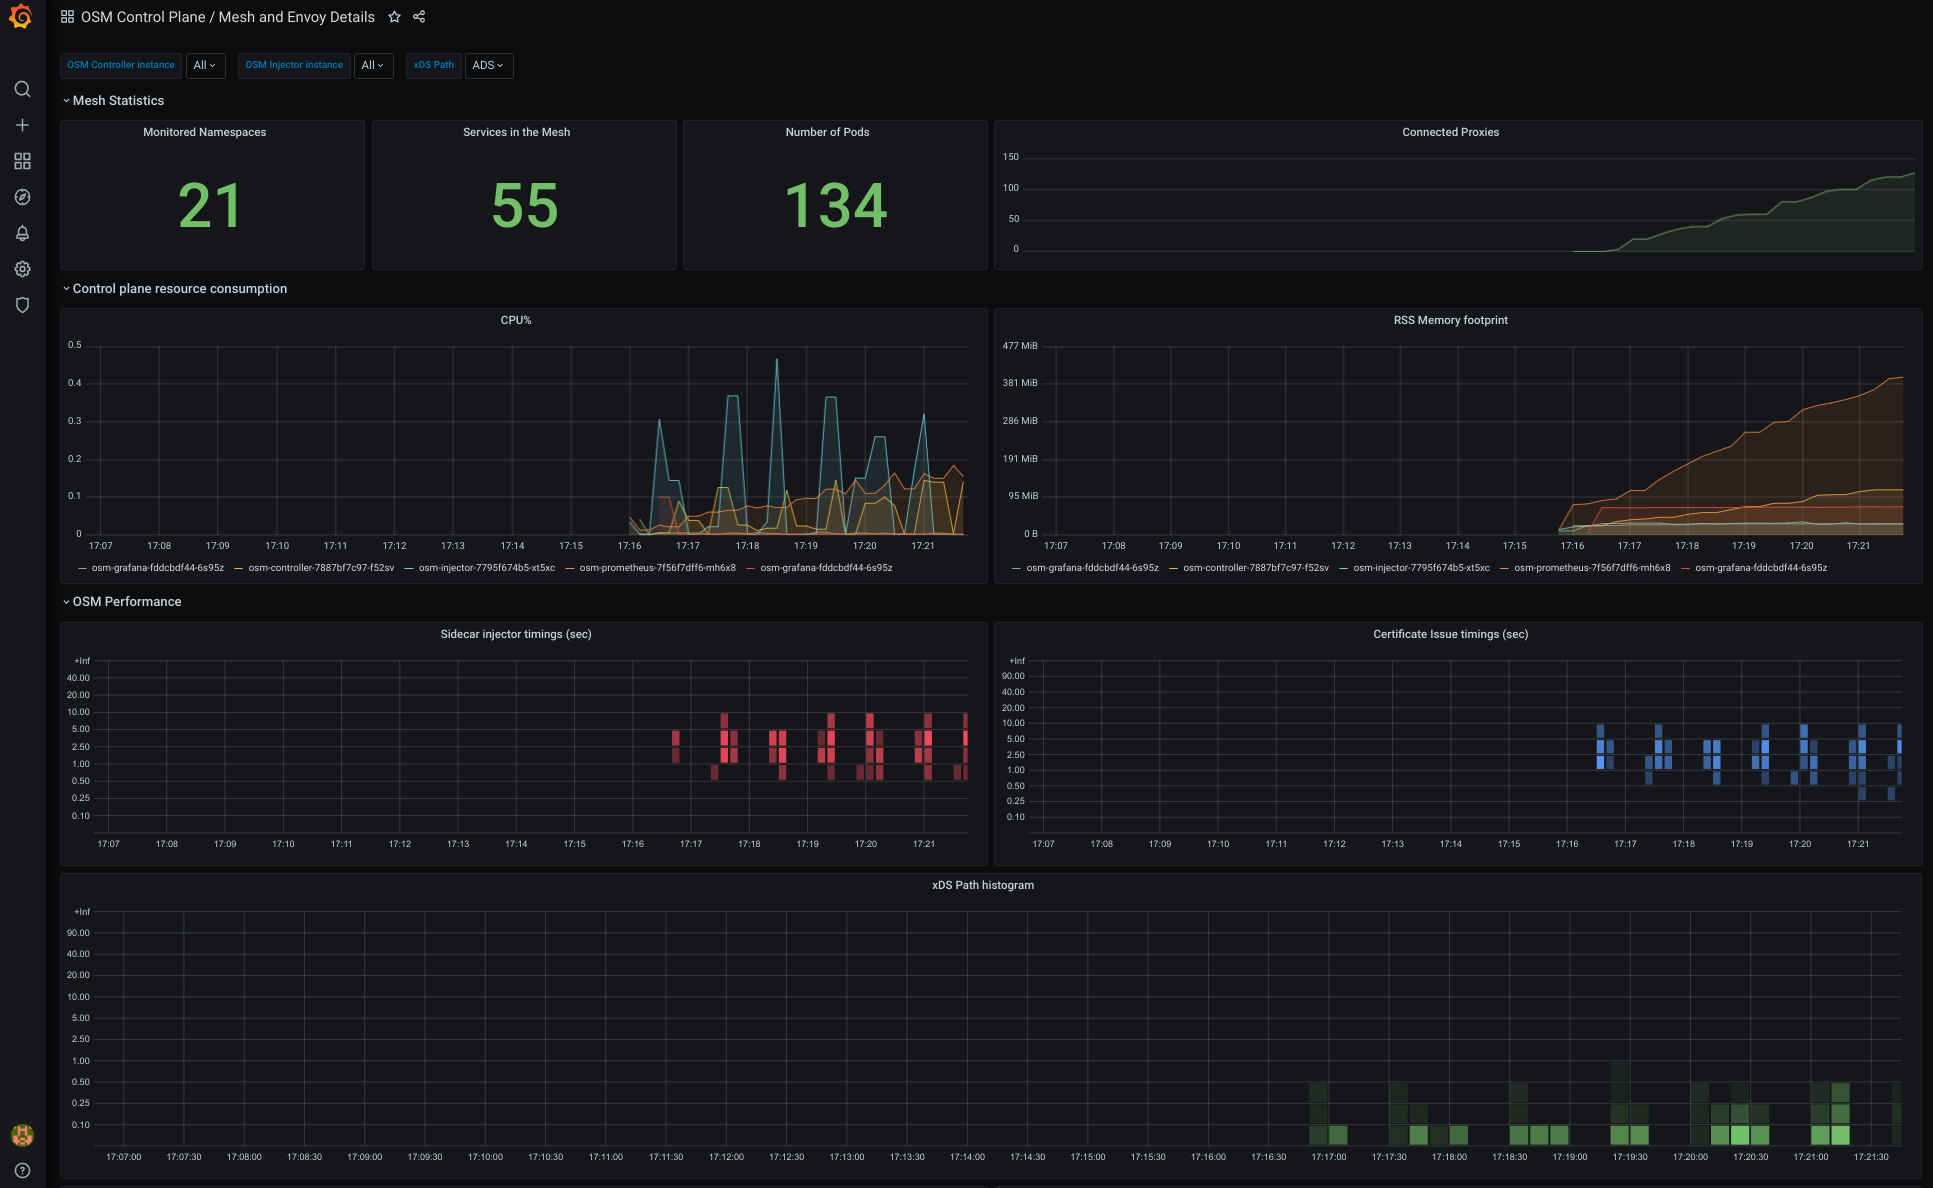
This dashboard lets you view the performance and behavior of OSM’s control plane.
Export Dashboard✕
Download
Copy to Clipboard
Used Metrics 1212
osm_resource_namespace_count
osm_proxy_connect_count
-
container_cpu_usage_seconds_total
container
POD
-
container_memory_rss
osm_injector_injector_rq_time_bucket
osm_cert_issued_time_bucket
osm_proxy_config_update_time_bucket
osm_injector_injector_rq_time_count
osm_proxy_config_update_time_count
osm_error_err_code_count