PostgreSQL Exporter Quickstart and Dashboard 8,627,7178,627,717 5.0 (1 reviews)
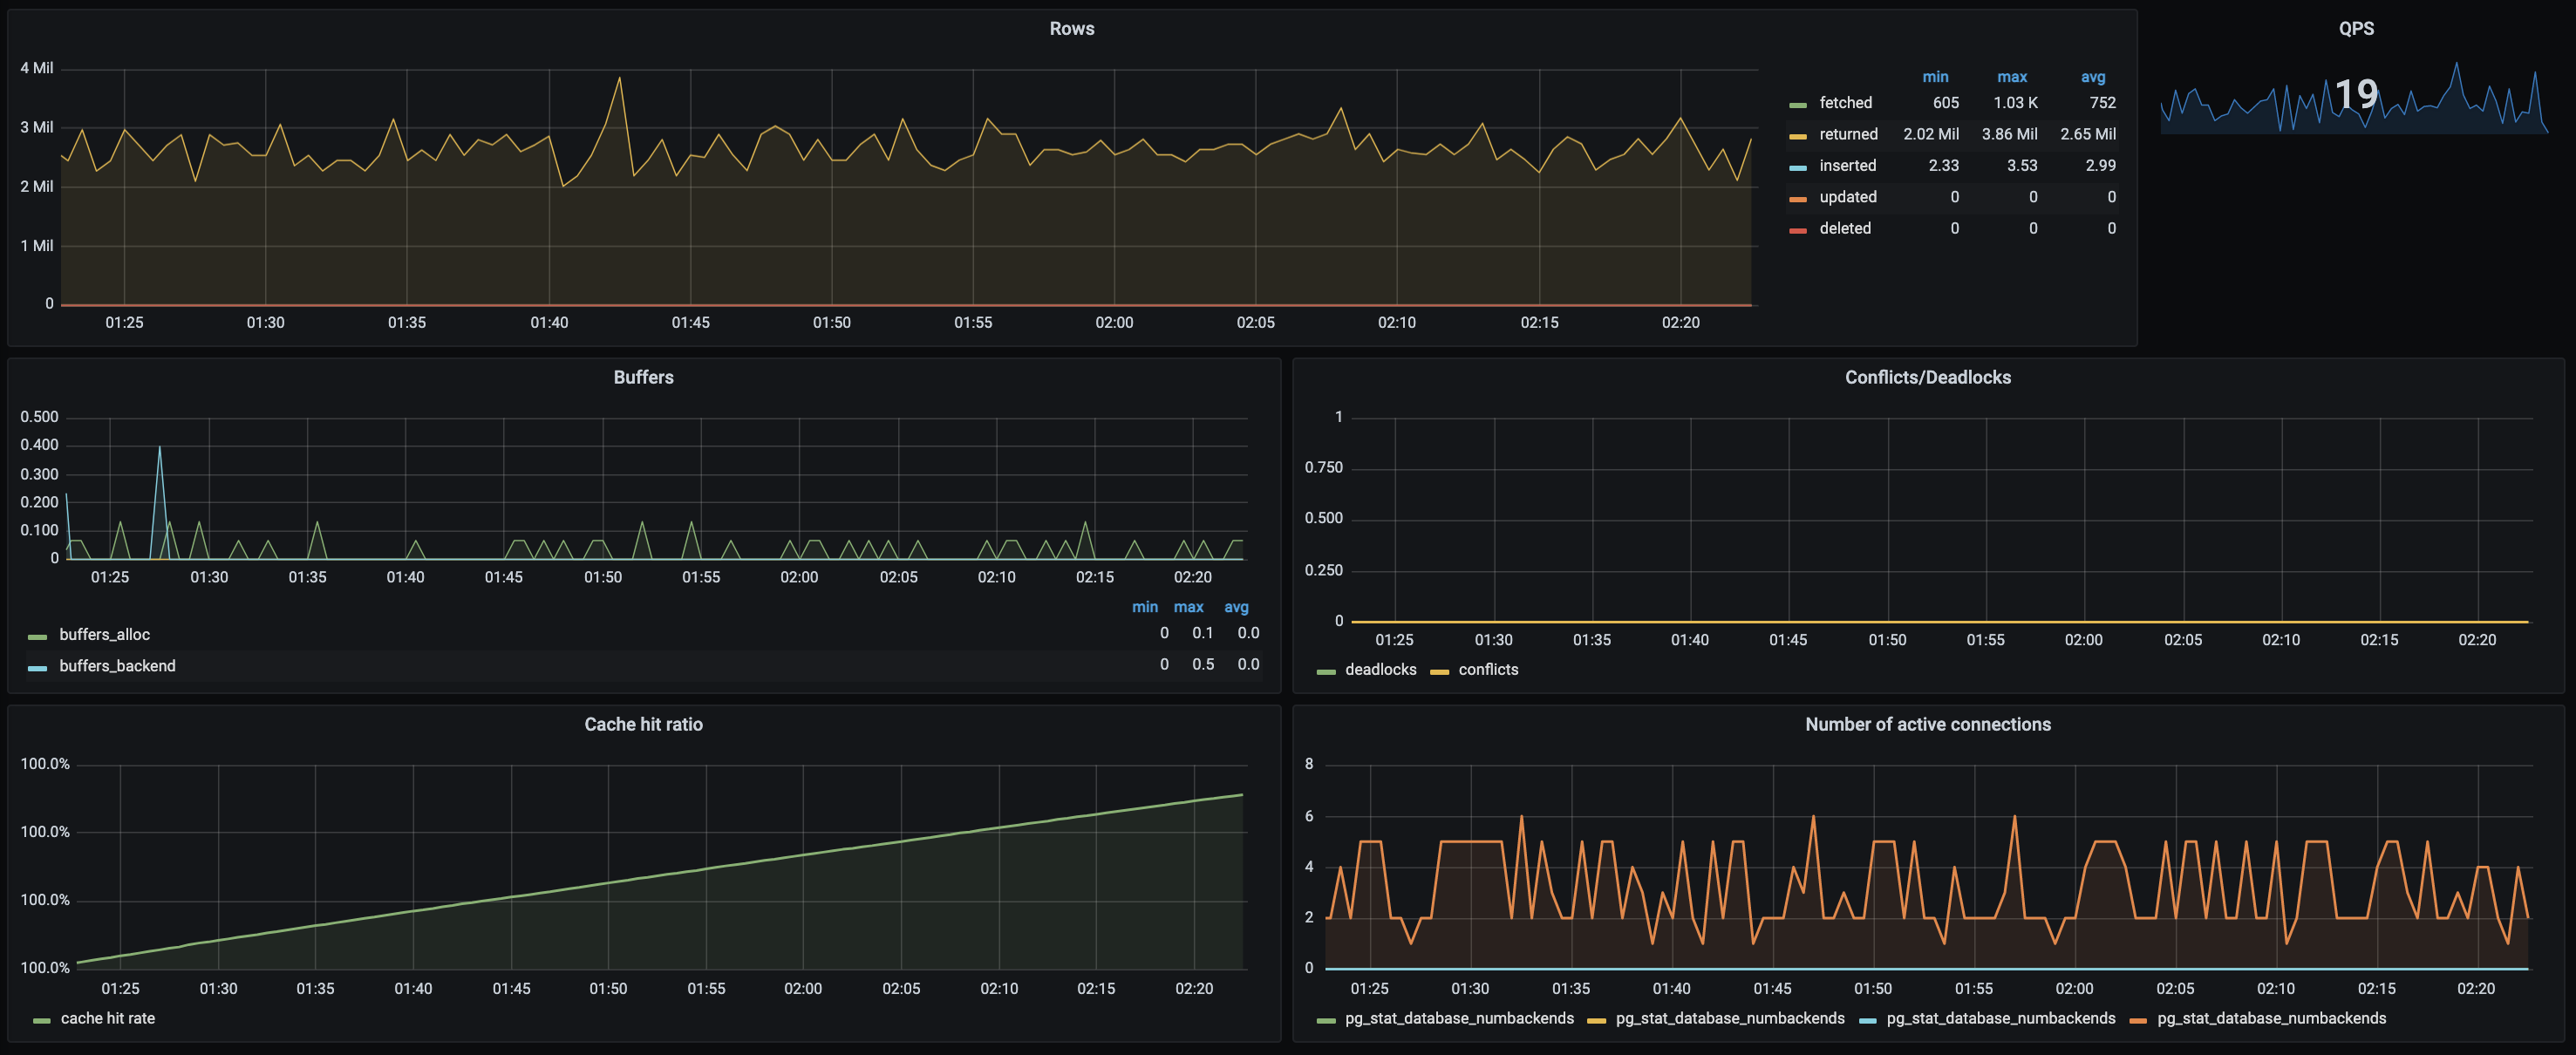
To use this dashboard, please follow the PostgreSQL Exporter Quickstart. This quickstart helps you monitor your Postgres server by setting up the Prometheus Postgres exporter with preconfigured dashboards, alerting rules, and recording rules. This dashboard includes panels for the following metrics:
- Current QPS
- Fetched, Returned, Inserted, Updated, Deleted Rows
- Database Deadlocks and Conflicts
- Cache Hit Ratio
- Number of Active Connections
- Buffers
This dashboard was generated using the Postgres Exporter mixin.
Used Metrics 1717
-
pg_stat_database_tup_fetched
-
pg_stat_database_tup_returned
-
pg_stat_database_tup_inserted
-
pg_stat_database_tup_updated
-
pg_stat_database_tup_deleted
-
pg_stat_database_xact_commit
-
pg_stat_database_xact_rollback
-
pg_stat_bgwriter_buffers_alloc
-
pg_stat_bgwriter_buffers_backend_fsync
-
pg_stat_bgwriter_buffers_backend
-
pg_stat_bgwriter_buffers_clean
-
pg_stat_bgwriter_buffers_checkpoint
-
pg_stat_database_deadlocks
-
pg_stat_database_conflicts
-
pg_stat_database_blks_hit
-
pg_stat_database_blks_read
-
pg_stat_database_numbackends