Go Runtime Exporter Quickstart and Dashboardby Grafana Labs 9,9349,934
To use this dashboard, please follow the Go Client Library Quickstart. This quickstart helps you monitor your Go app and set up a preconfigured dashboard. This dashboard includes panels for the following metrics:
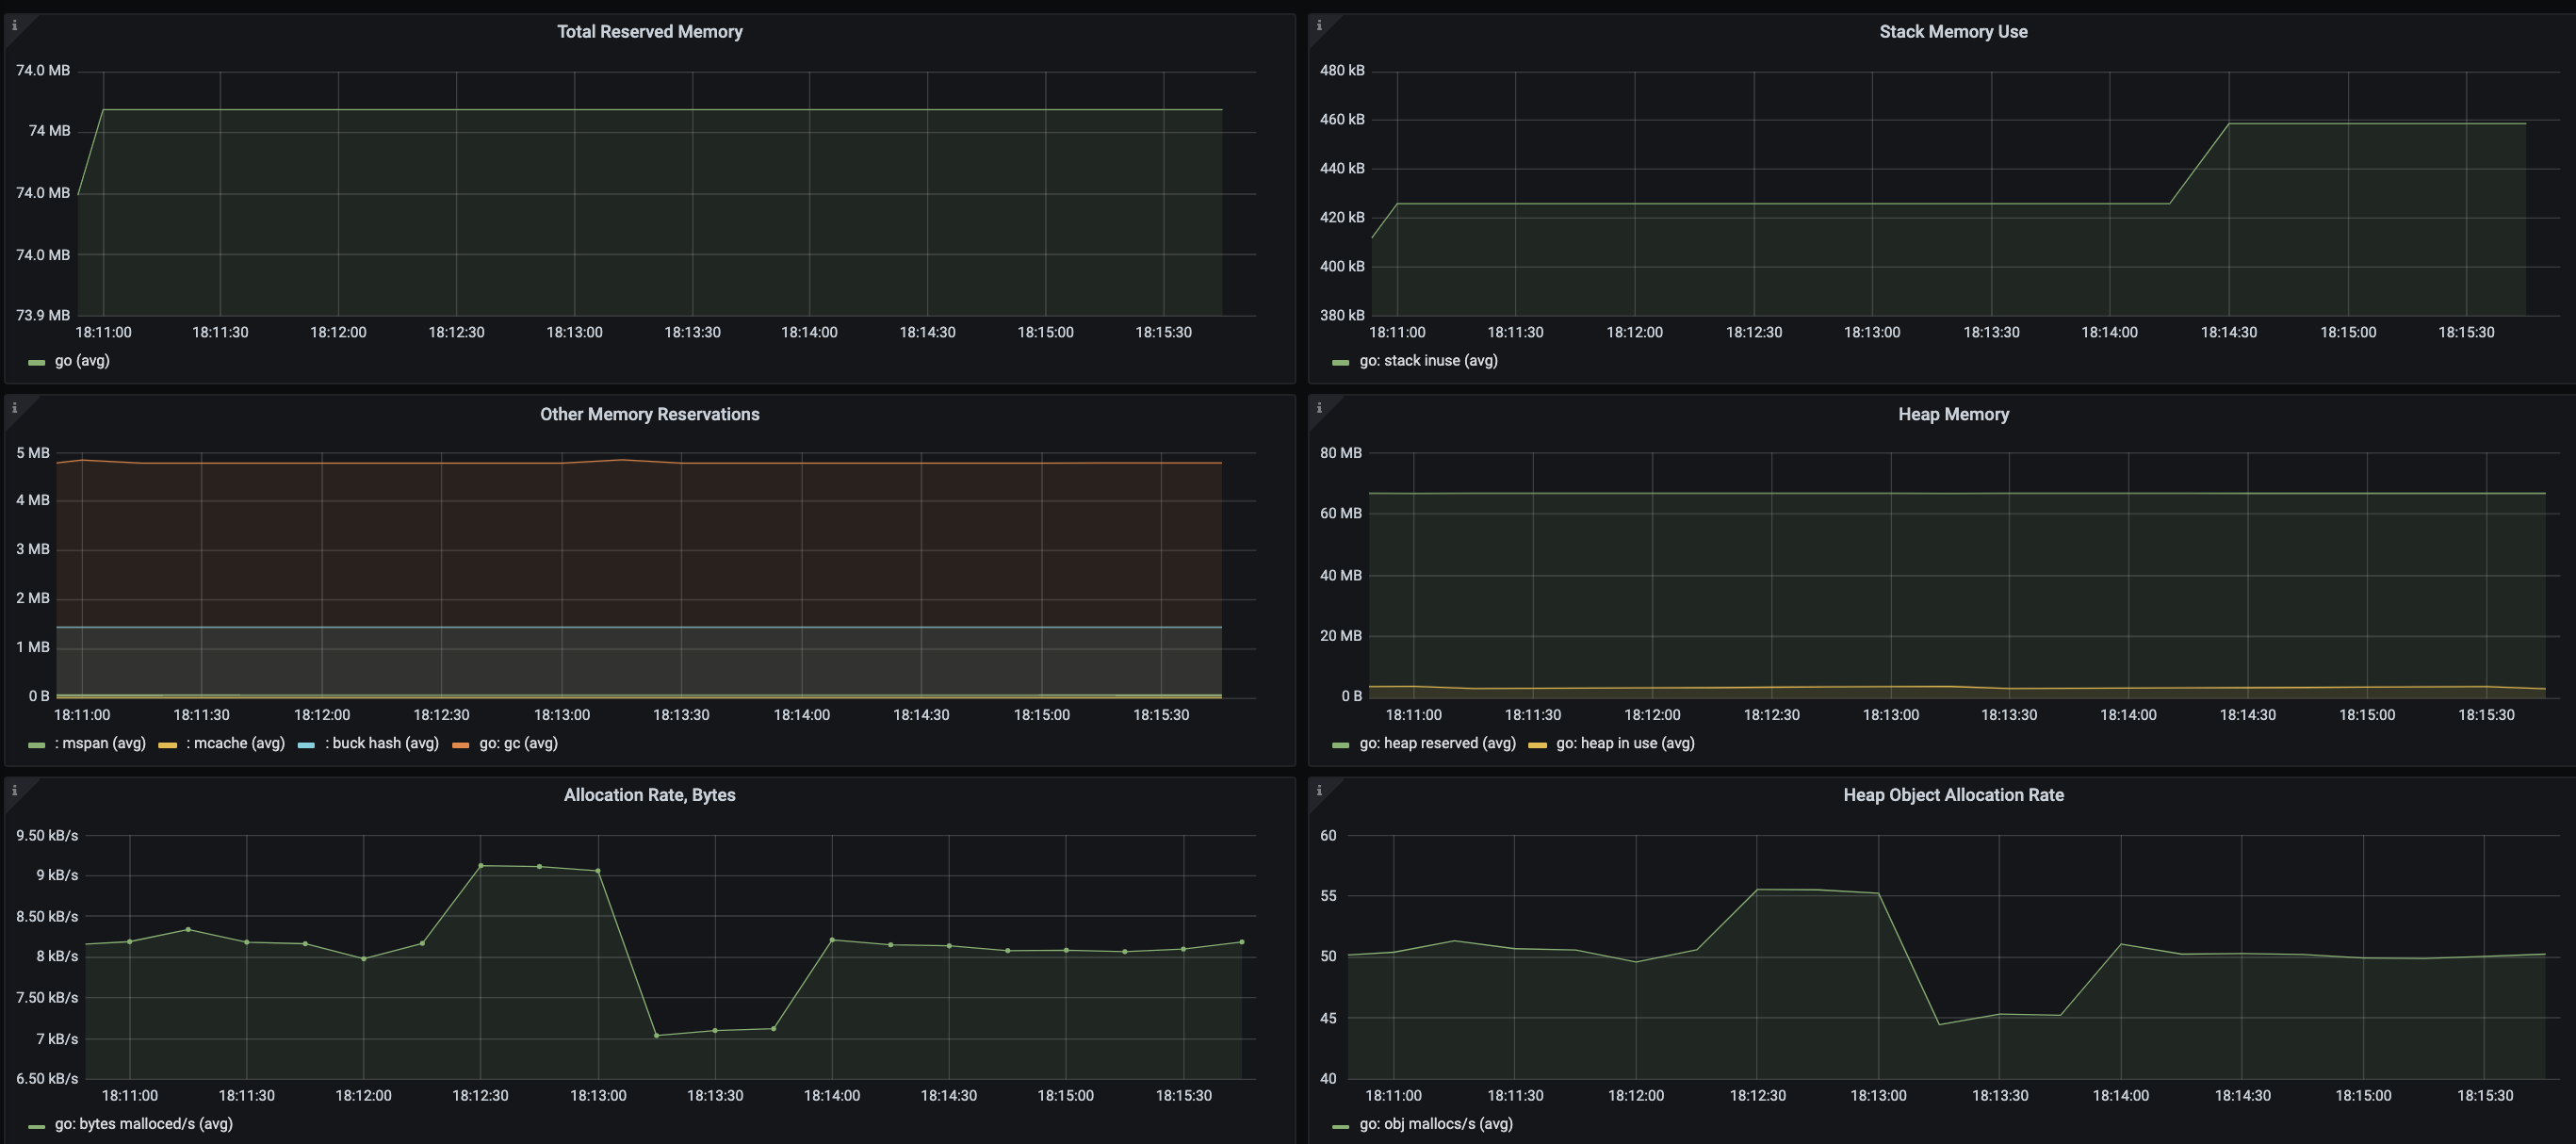
- Total Reserved Memory
- Stack Memory Use
- Other Memory Reservations
- Heap Memory
- Allocation Rate, Bytes
- Heap Object Allocation Rate
- Number of Live Objects
- Goroutines
- GC min & max duration
- Next GC, Bytes
This dashboard was generated using the Prometheus Go Client Library mixin. If you need to modify or regenerate it, please see the mixin repository.
Used Metrics 1717
-
go_memstats_sys_bytes
-
go_memstats_stack_sys_bytes
-
go_memstats_mspan_sys_bytes
-
go_memstats_mcache_sys_bytes
-
go_memstats_buck_hash_sys_bytes
-
go_memstats_gc_sys_bytes
-
go_memstats_heap_sys_bytes
-
go_memstats_heap_inuse_bytes
-
go_memstats_heap_alloc_bytes
-
go_memstats_heap_idle_bytes
-
go_memstats_heap_released_bytes
-
go_memstats_alloc_bytes_total
-
go_memstats_mallocs_total
-
go_memstats_frees_total
-
go_goroutines
-
go_gc_duration_seconds
-
go_memstats_next_gc_bytes