Node.js Exporter Quickstart and Dashboard 39,46339,463 5.0 (1 reviews)
To use this dashboard, please follow the Node.js Exporter Quickstart. This quickstart helps you monitor your Node.js server by setting up prom-client for Node.js with preconfigured dashboards, alerting rules, and recording rules. This dashboard includes panels for the following metrics:
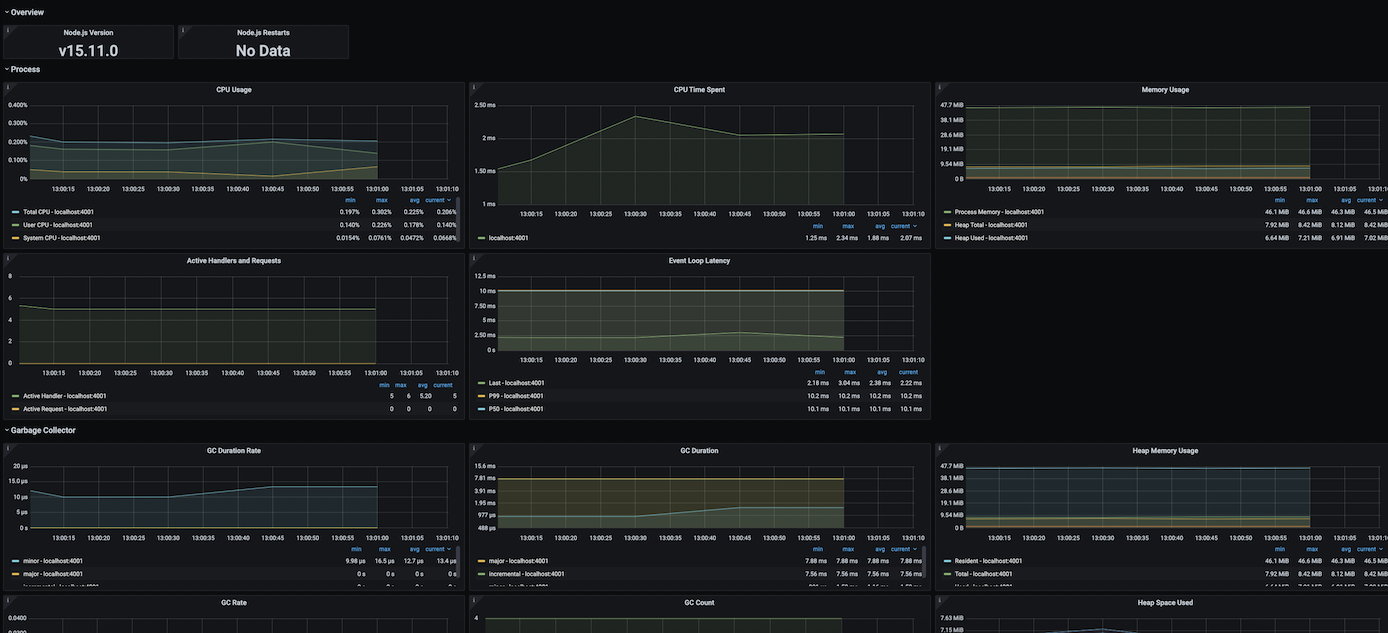
- Node.js Version
- Node.js Restarts
- CPU Usage
- CPU Time Spent
- Memory Usage
- Active Handlers and Requests
- Event Loop Latency
- GC Duration Rate
- GC Duration
- Heap Memory Usage
- GC Rate
- GC Count
- Heap Space Used
This dashboard was generated using the Node.js Exporter mixin. If you need to modify or regenerate it, please see the mixin repository.
Used Metrics 1818
-
nodejs_version_info
-
process_start_time_seconds
-
process_cpu_user_seconds_total
-
process_cpu_system_seconds_total
-
process_cpu_seconds_total
interval
-
process_resident_memory_bytes
-
nodejs_heap_size_total_bytes
-
nodejs_heap_size_used_bytes
-
nodejs_external_memory_bytes
-
nodejs_active_handles_total
-
nodejs_active_requests_total
-
nodejs_eventloop_lag_seconds
-
nodejs_eventloop_lag_p99_seconds
-
nodejs_eventloop_lag_p50_seconds
nodejs_gc_duration_seconds_sum
nodejs_gc_duration_seconds_count
-
nodejs_heap_space_size_used_bytes