MySQL Dashboard 12,86812,868 5.0 (1 reviews)
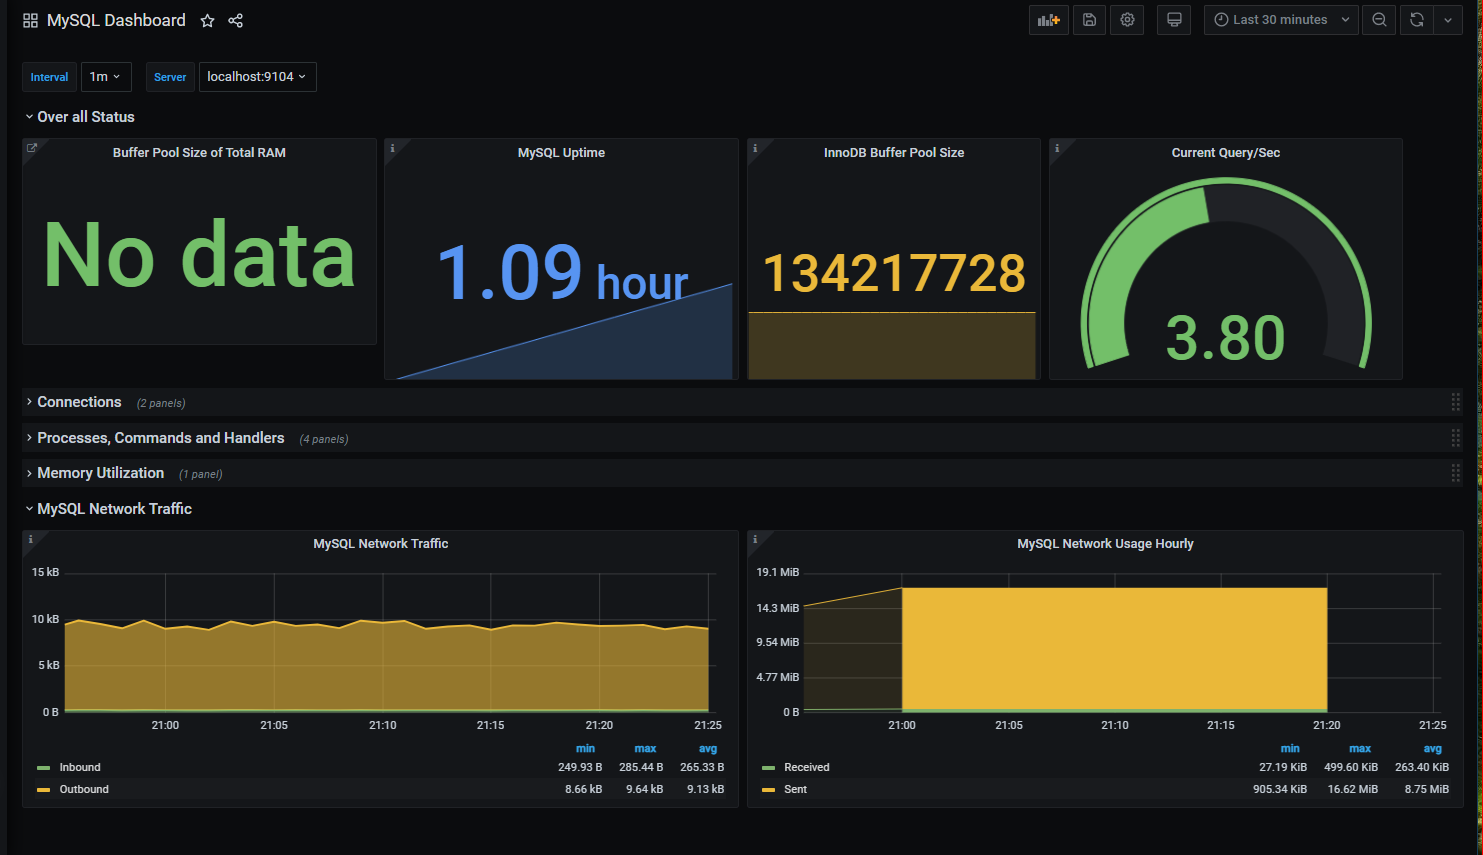
The Dashboard Show Memory utilization, Network Traffic Monitoring, CPU Utilization and Other Metrics pulled from Prometheus Data Sources Configured with MySQL Node Exporter.
Used Metrics 2121
-
mysql_global_variables_innodb_buffer_pool_size
-
node_memory_MemTotal_bytes
-
mysql_global_status_uptime
-
mysql_global_status_queries
interval
-
mysql_global_status_threads_connected
-
mysql_global_status_max_used_connections
-
mysql_global_variables_max_connections
-
mysql_global_status_threads_running
topk
-
mysql_global_status_commands_total
-
mysql_global_status_handlers_total
-
mysql_global_status_innodb_page_size
-
mysql_global_status_buffer_pool_pages
-
mysql_global_variables_innodb_log_buffer_size
mysql_global_variables_innodb_additional_mem_pool_size
mysql_global_status_innodb_mem_dictionary
-
mysql_global_variables_key_buffer_size
mysql_global_status_innodb_mem_adaptive_hash
-
mysql_global_status_bytes_received
-
mysql_global_status_bytes_sent