Node Exporter Resources Overview 7,7047,704
1/9/2021
1/27/2022
3
Host Metrics
>=8.2.2
Prometheus
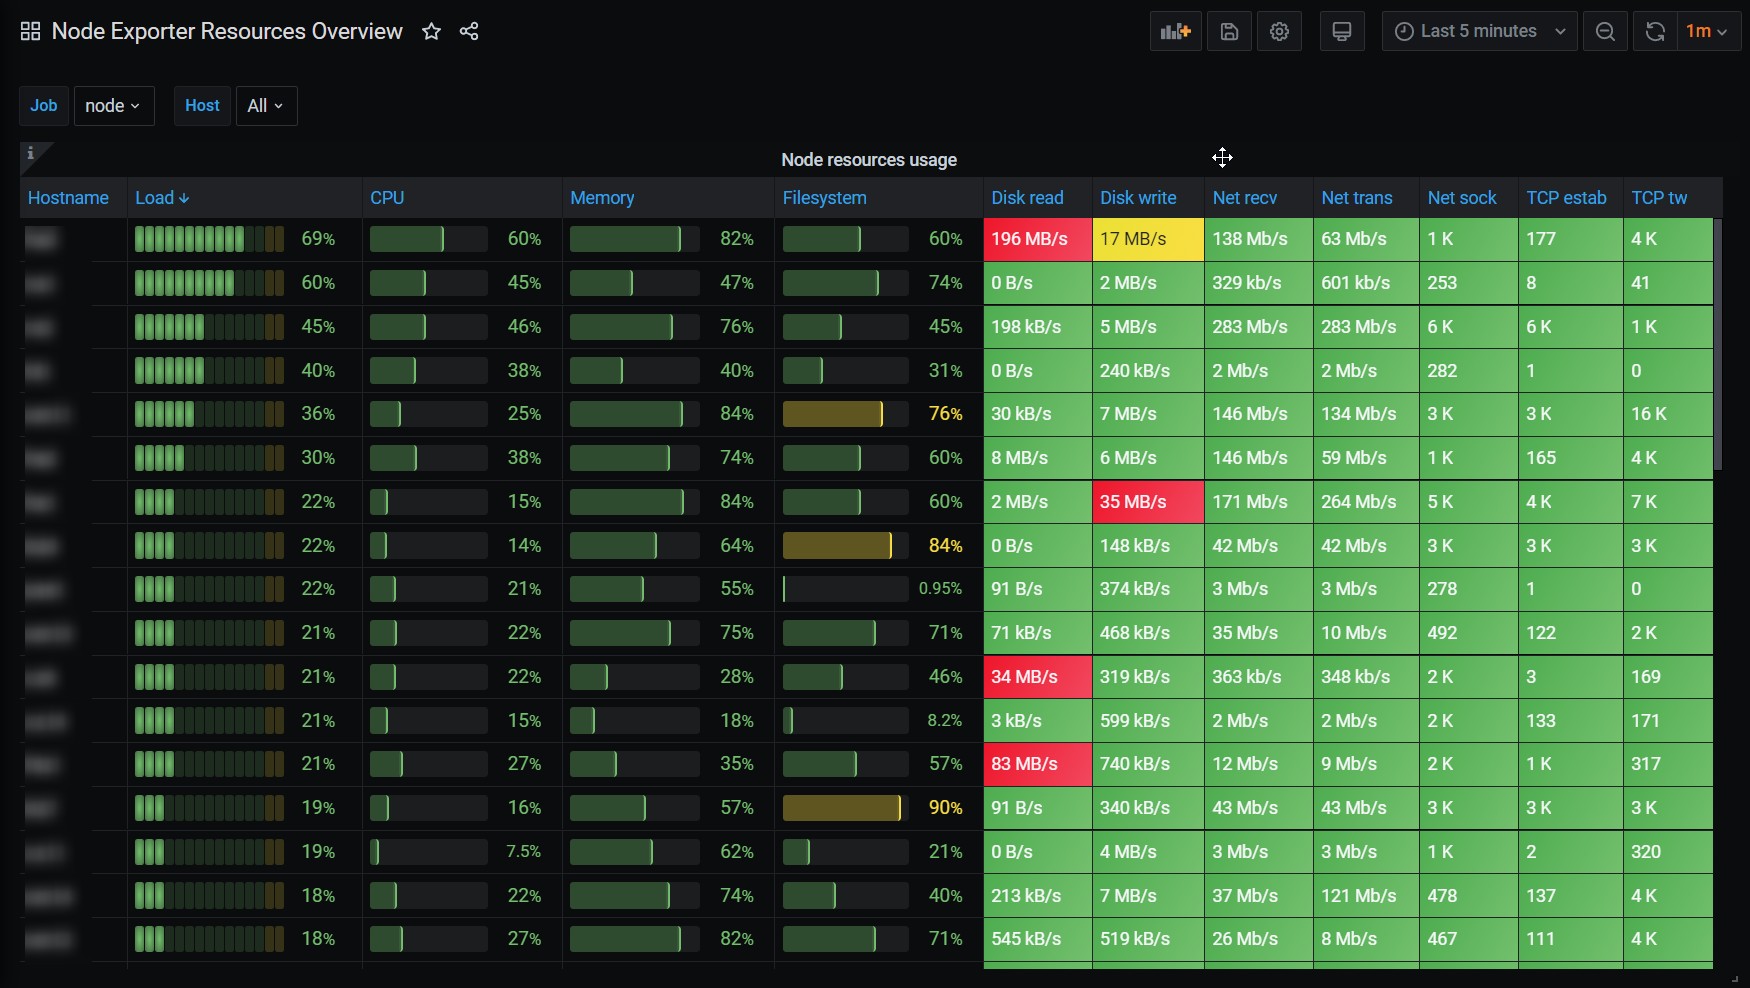
Grafana >=7 single panel nodes resources overview. Hostnames in first column are clickable and opens node detail with dashboard https://grafana.com/grafana/dashboards/1860 so you probably have to install it too.
Insipired by https://grafana.com/grafana/dashboards/11074
Export Dashboard✕
Download
Copy to Clipboard
Used Metrics 1414
-
node_uname_info
-
node_cpu_seconds_total
-
node_memory_MemAvailable_bytes
-
node_memory_MemTotal_bytes
-
node_filesystem_free_bytes
-
node_filesystem_size_bytes
-
node_disk_read_bytes_total
-
node_disk_written_bytes_total
-
node_netstat_Tcp_CurrEstab
-
node_sockstat_TCP_tw
-
node_network_receive_bytes_total
-
node_network_transmit_bytes_total
-
node_load1
-
node_sockstat_sockets_used