Web3Signer Overview 26,17826,178
Web3Signer Eth2 Overview
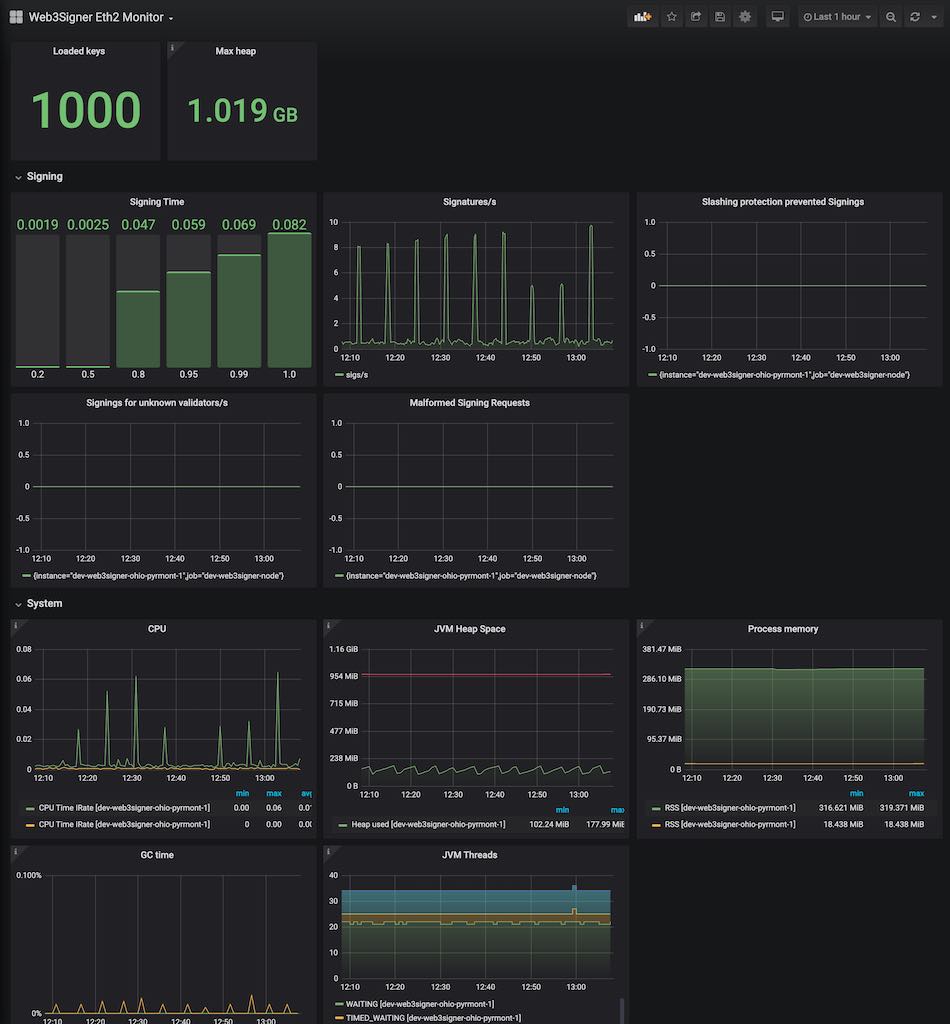
Provides a dashboard for monitoring a Web3Signer Eth2 node. The required data is exported directly from Web3Signer to a Prometheus data store. See the documentation on how to configure Web3Signer and Prometheus.
The dashboard provides information on how well Web3Signer is signing Eth2 requests, slashing protection statistics, Teku is to the network, current, justified and finalized slot and epoch information, along with CPU and memory usage statistics.
Used Metrics 1313
process_release
signing_signers_loaded_count
jvm_memory_bytes_max
http_bls_malformed_request_count
eth2_slashingprotection_prevented_signings
signing_bls_missing_identifier_count
signing_bls_signing_duration
signing_bls_signing_duration_count
-
process_cpu_seconds_total
jvm_memory_bytes_used
-
process_resident_memory_bytes
jvm_gc_collection_seconds_sum
jvm_threads_state