Prometheus 2.22 1,2211,221
Pormetheus Overview
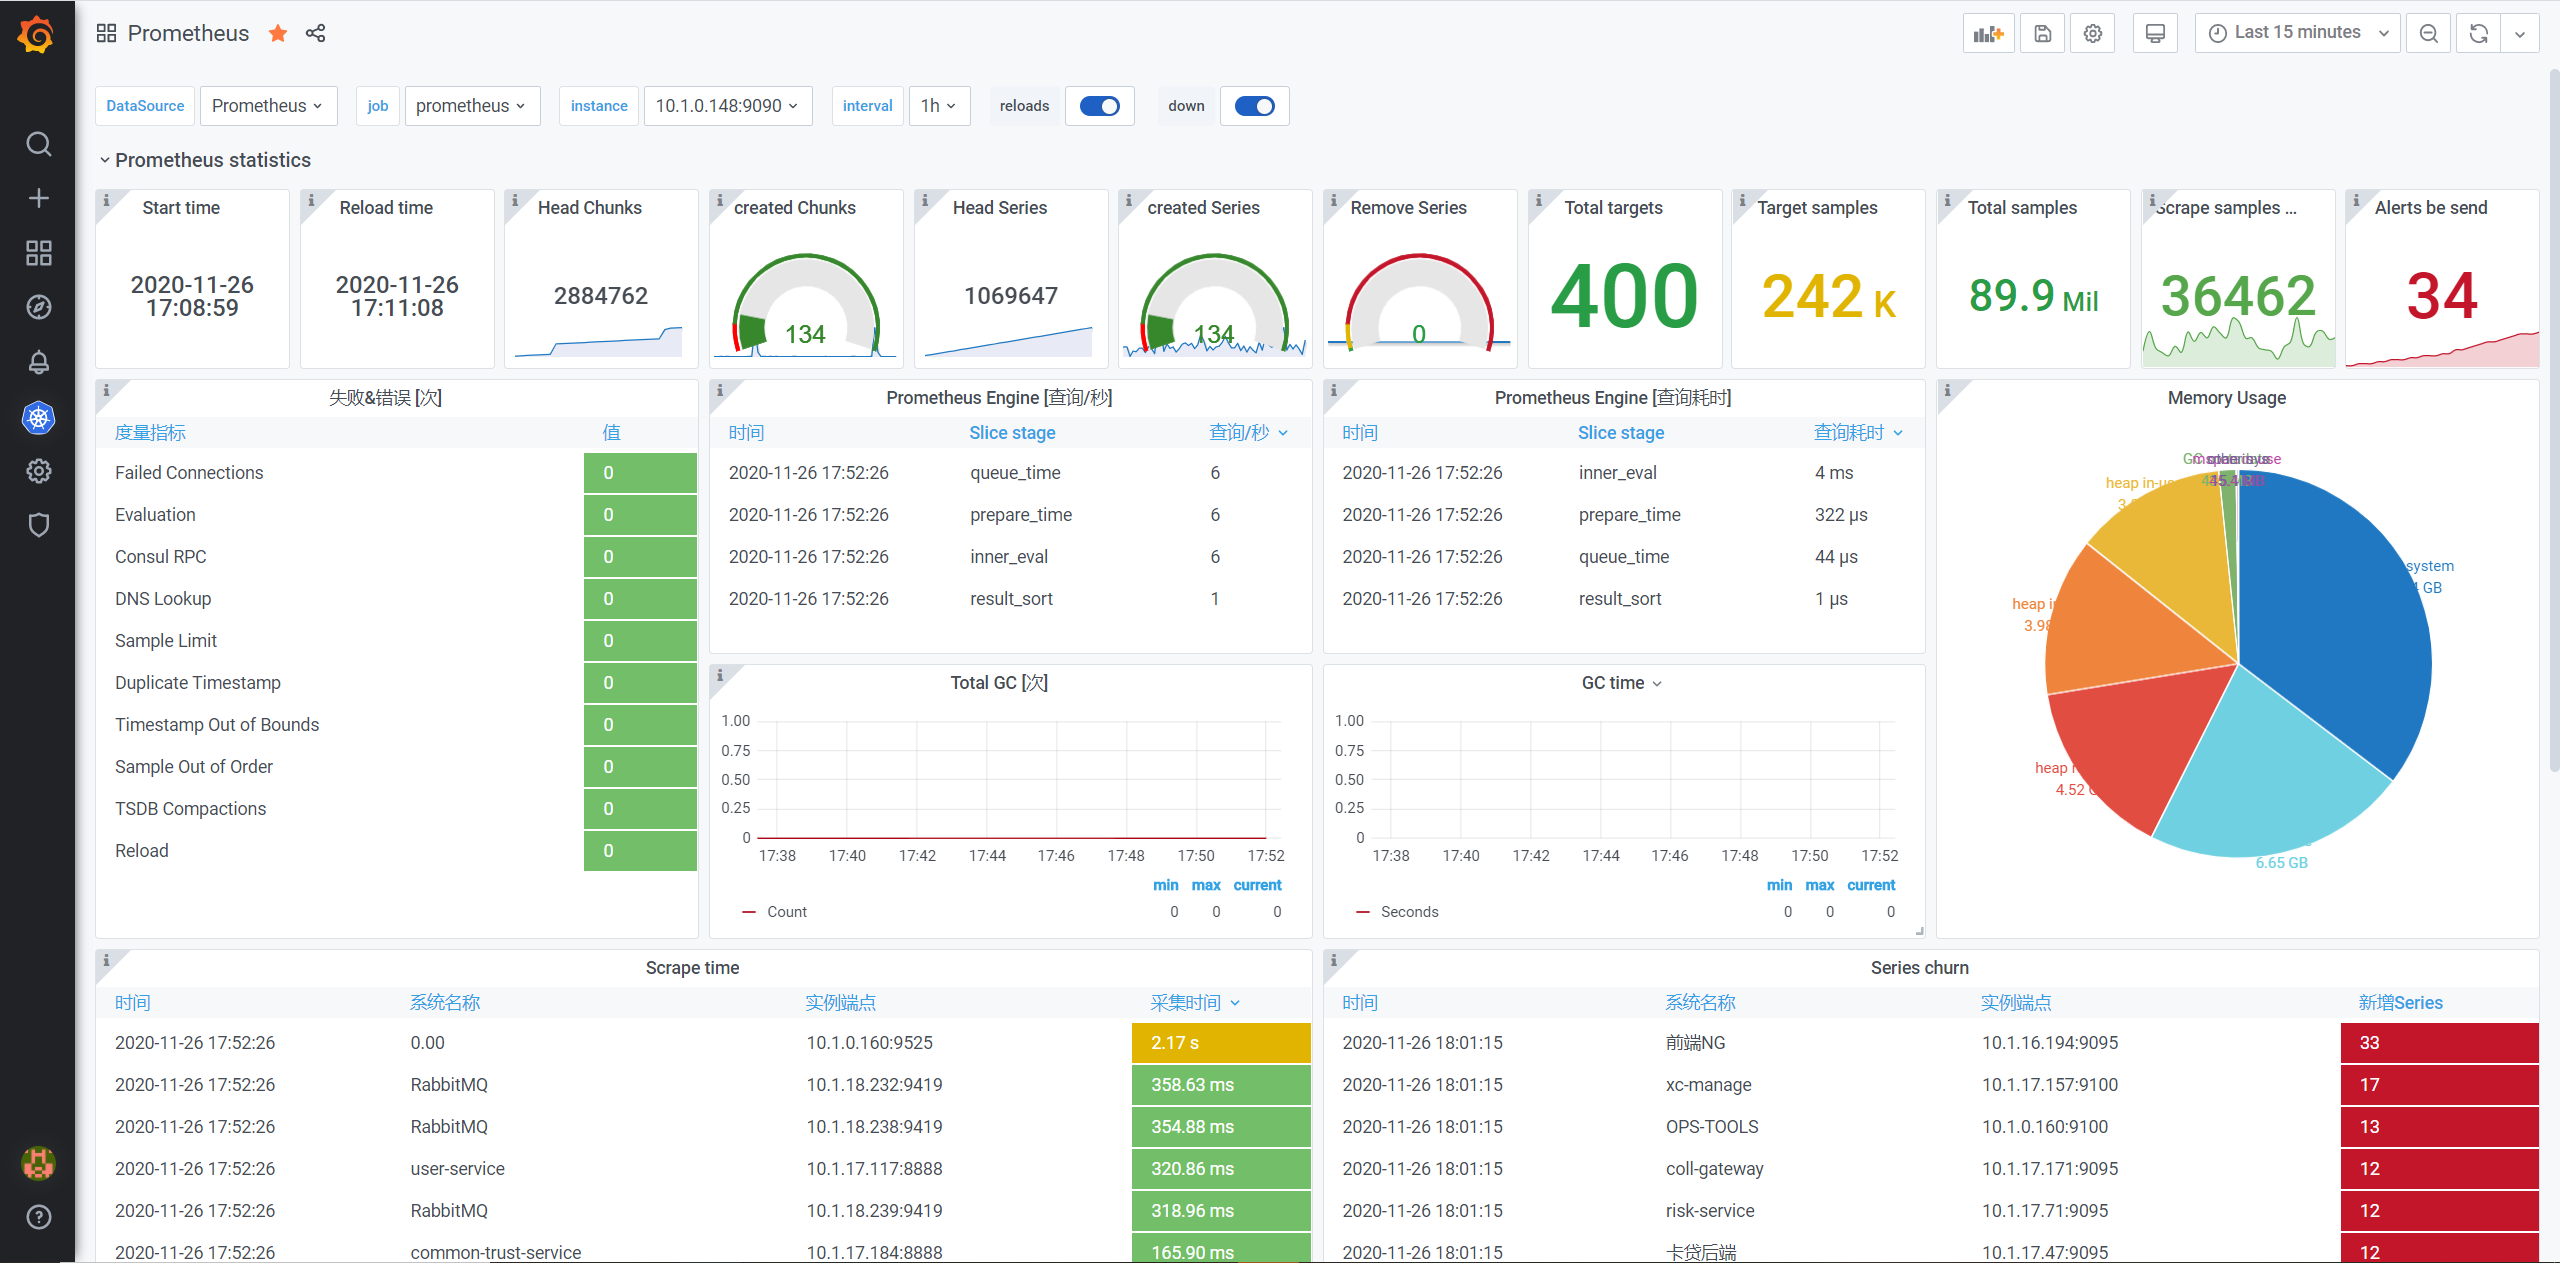
1、add prometheus start time & configraiton file reload time and chunk/series/target/samples/alerts statistics
2、add prometheus engine infomation and memory utilization and GC
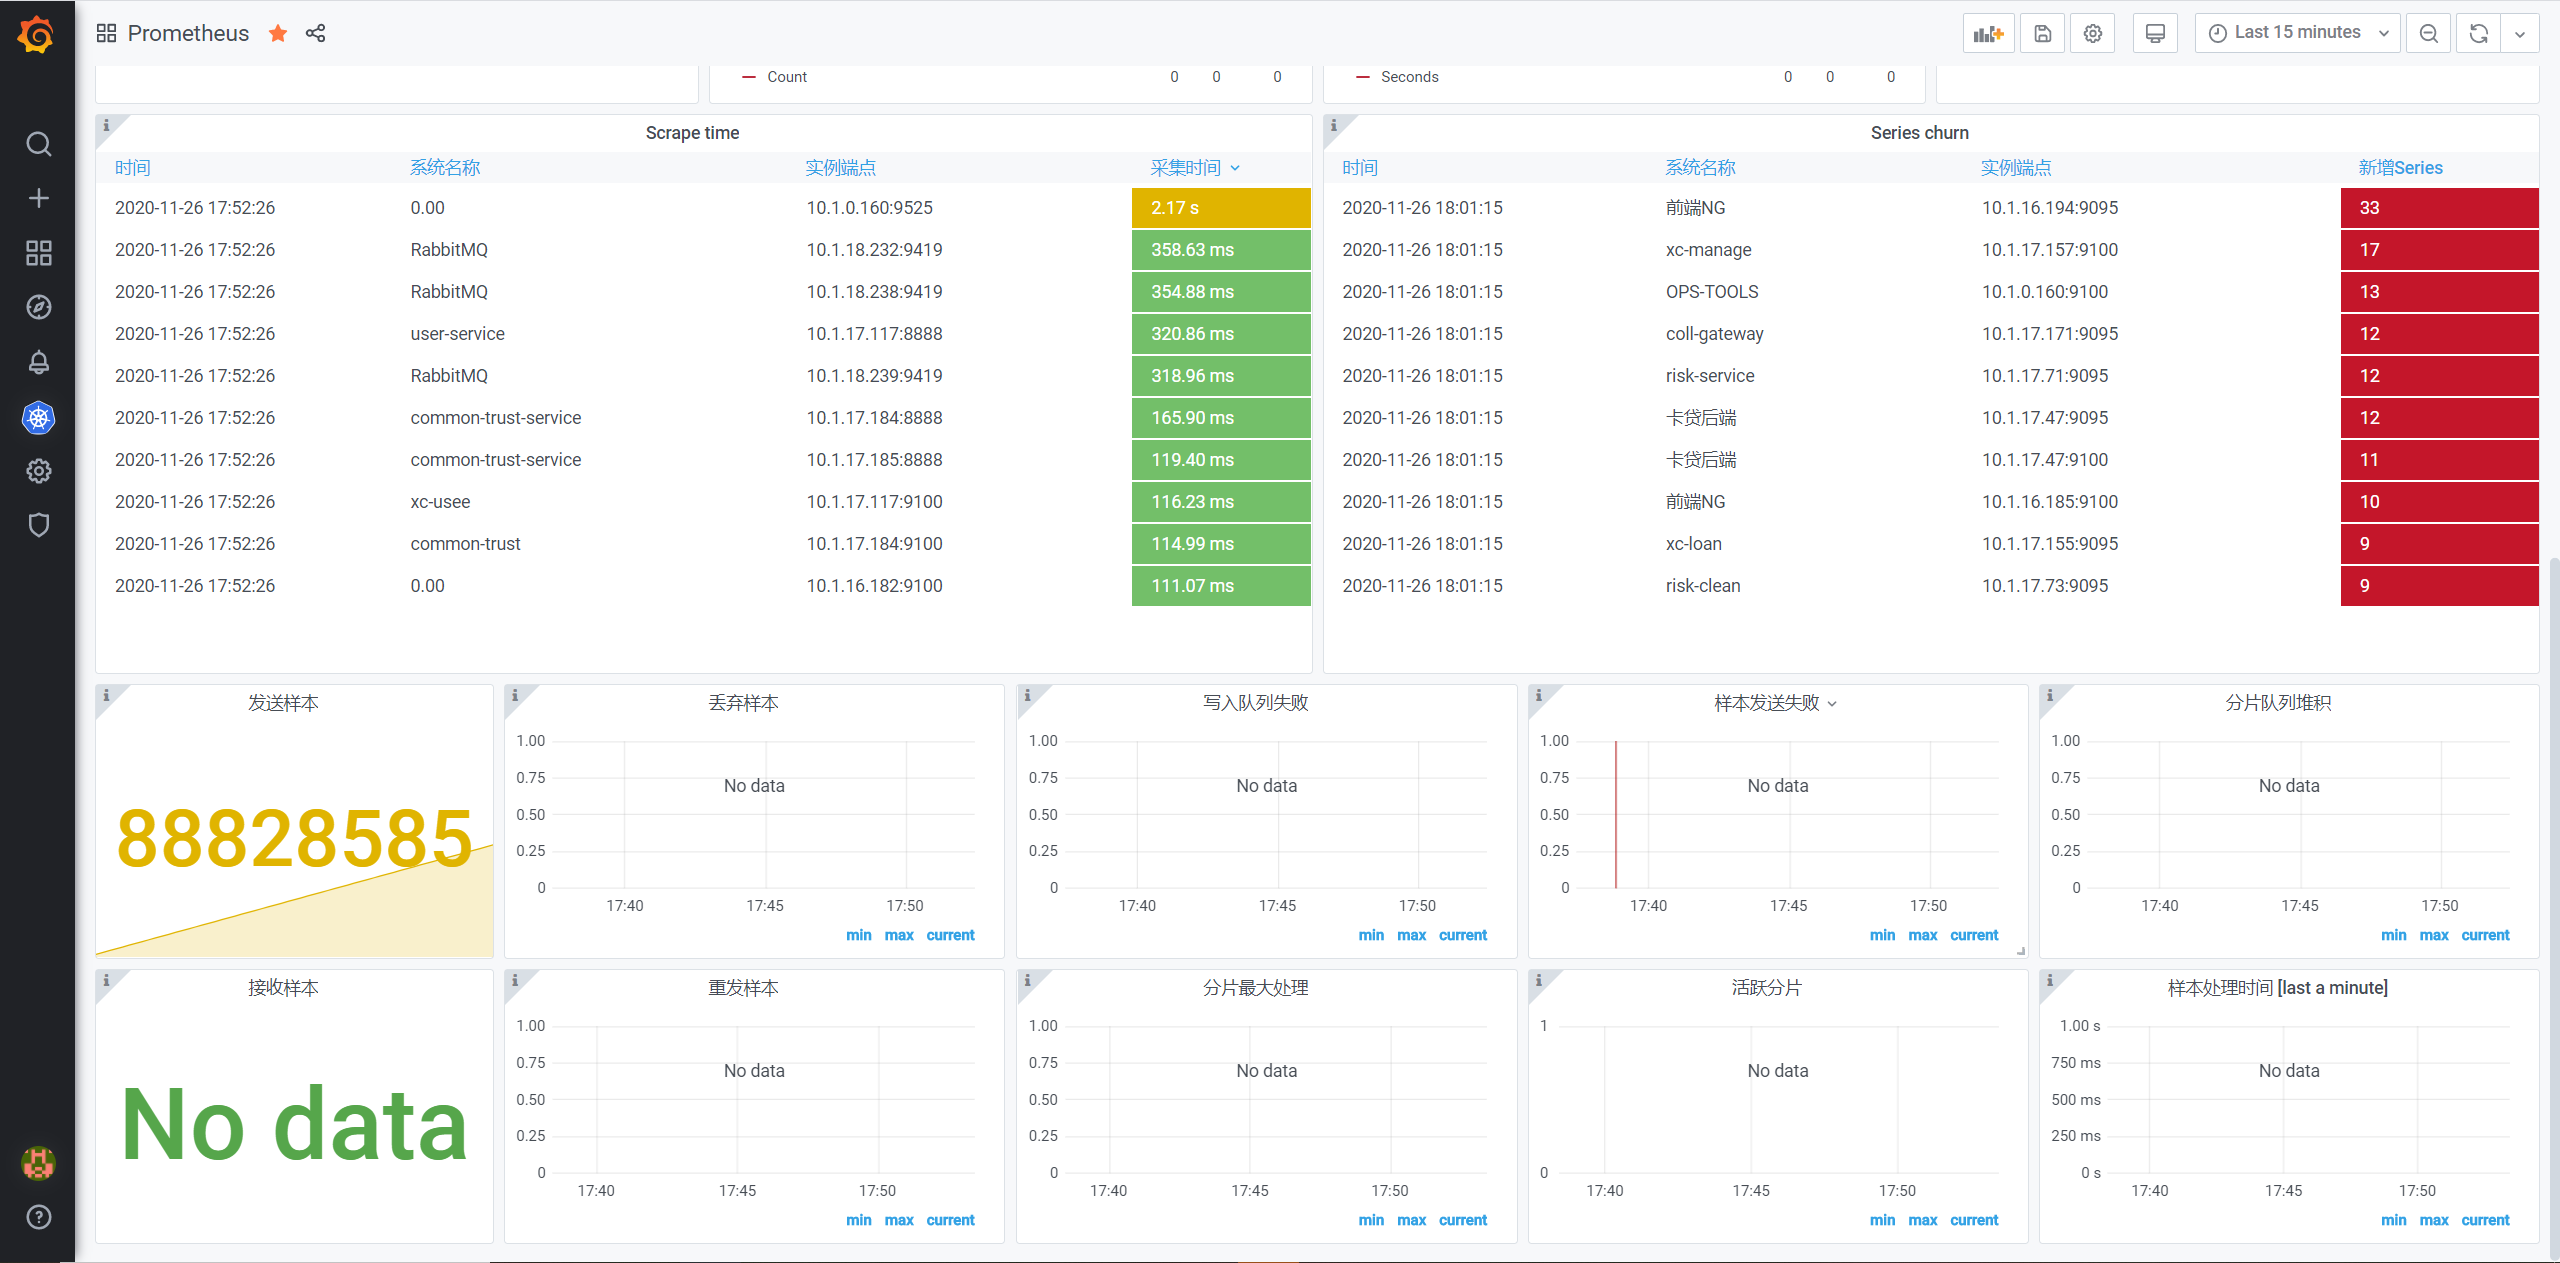
3、add prometheus scrape time and estimate of churn, with series being added to the cache being considered churn. This will have both false positives (e.g. series appearing and disappearing) and false negatives (e.g. series hit sample_limit, but still created in head block), but should be generally useful as-is
4、add remote storage's send samples&recive smaples and share utilization
Used Metrics 6868
-
process_start_time_seconds
-
prometheus_config_last_reload_success_timestamp_seconds
-
prometheus_tsdb_head_chunks
-
prometheus_tsdb_head_chunks_created_total
-
prometheus_tsdb_head_series_removed_total
-
prometheus_tsdb_head_series
-
prometheus_tsdb_head_series_created_total
-
prometheus_sd_discovered_targets
-
up
-
scrape_samples_scraped
-
prometheus_tsdb_head_samples_appended_total
-
prometheus_notifications_sent_total
-
net_conntrack_dialer_conn_failed_total
prometheus_evaluator_iterations_missed_total
prometheus_evaluator_iterations_skipped_total
-
prometheus_rule_evaluation_failures_total
prometheus_sd_azure_refresh_failures_total
-
prometheus_sd_consul_rpc_failures_total
-
prometheus_sd_dns_lookup_failures_total
prometheus_sd_ec2_refresh_failures_total
prometheus_sd_gce_refresh_failures_total
prometheus_sd_marathon_refresh_failures_total
prometheus_sd_openstack_refresh_failures_total
prometheus_sd_triton_refresh_failures_total
-
prometheus_target_scrapes_exceeded_sample_limit_total
-
prometheus_target_scrapes_sample_duplicate_timestamp_total
-
prometheus_target_scrapes_sample_out_of_bounds_total
-
prometheus_target_scrapes_sample_out_of_order_total
-
prometheus_treecache_zookeeper_failures_total
-
prometheus_tsdb_compactions_failed_total
prometheus_tsdb_head_series_not_found
-
prometheus_tsdb_reloads_failures_total
prometheus_engine_query_duration_seconds_count
prometheus_engine_query_duration_seconds_sum
-
go_memstats_alloc_bytes_total
-
go_memstats_alloc_bytes
-
go_memstats_buck_hash_sys_bytes
-
go_memstats_gc_sys_bytes
-
go_memstats_heap_alloc_bytes
-
go_memstats_heap_idle_bytes
-
go_memstats_heap_inuse_bytes
-
go_memstats_heap_released_bytes
-
go_memstats_heap_sys_bytes
-
go_memstats_mcache_inuse_bytes
-
go_memstats_mcache_sys_bytes
-
go_memstats_mspan_inuse_bytes
-
go_memstats_mspan_sys_bytes
-
go_memstats_next_gc_bytes
-
go_memstats_other_sys_bytes
-
go_memstats_stack_inuse_bytes
-
go_memstats_stack_sys_bytes
-
go_memstats_sys_bytes
prometheus_tsdb_head_gc_duration_seconds_count
prometheus_tsdb_head_gc_duration_seconds_sum
topk
-
scrape_duration_seconds
-
scrape_series_added
prometheus_remote_storage_enqueue_retries_total
-
prometheus_remote_storage_samples_in_total
prometheus_remote_storage_dropped_samples_total
prometheus_remote_storage_failed_samples_total
prometheus_remote_storage_pending_samples
prometheus_remote_storage_succeeded_samples_total
prometheus_remote_storage_retried_samples_total
prometheus_remote_storage_shard_capacity
prometheus_remote_storage_shards
prometheus_remote_storage_sent_batch_duration_seconds_sum
prometheus_remote_storage_sent_batch_duration_seconds_count