SSL Certificate Monitor 29,97029,970 5.0 (9 reviews)
10/21/2020
3/12/2021
2
Web Servers
>=7.3.0
Prometheus
Hi, i'm Malte from OpenAdvice and i referred to this Dashboard in my Grafana Blog post:
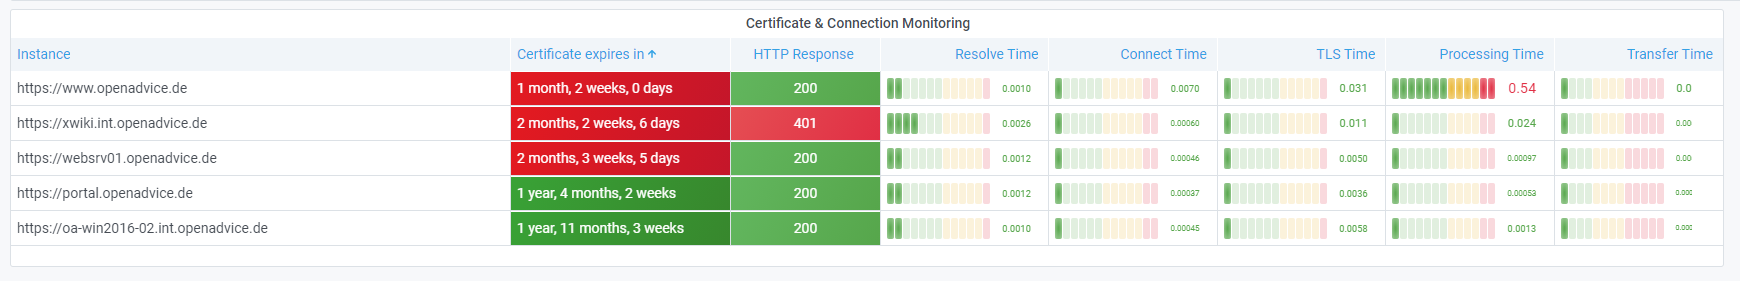
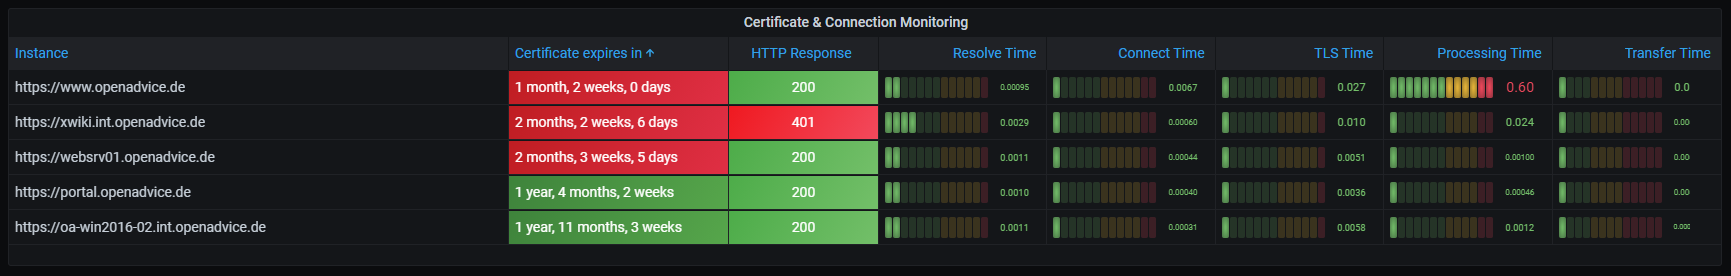
Most Applications rely on connections to APIs, databases and maybe some authentication service. If those connection are monitored with the Prometheus Blackbox_exporter you also get the certificate status.
This Dashboard has only one panel to demonstrate how to display all connection metrics utilizing the new Grafana 7 table panel features.
Export Dashboard✕
Download
Copy to Clipboard