Website monitoring 20,333,42120,333,421 3.7 (3 reviews)
9/20/2020
3/19/2021
4
Web Servers
>=7.2.0
Prometheus
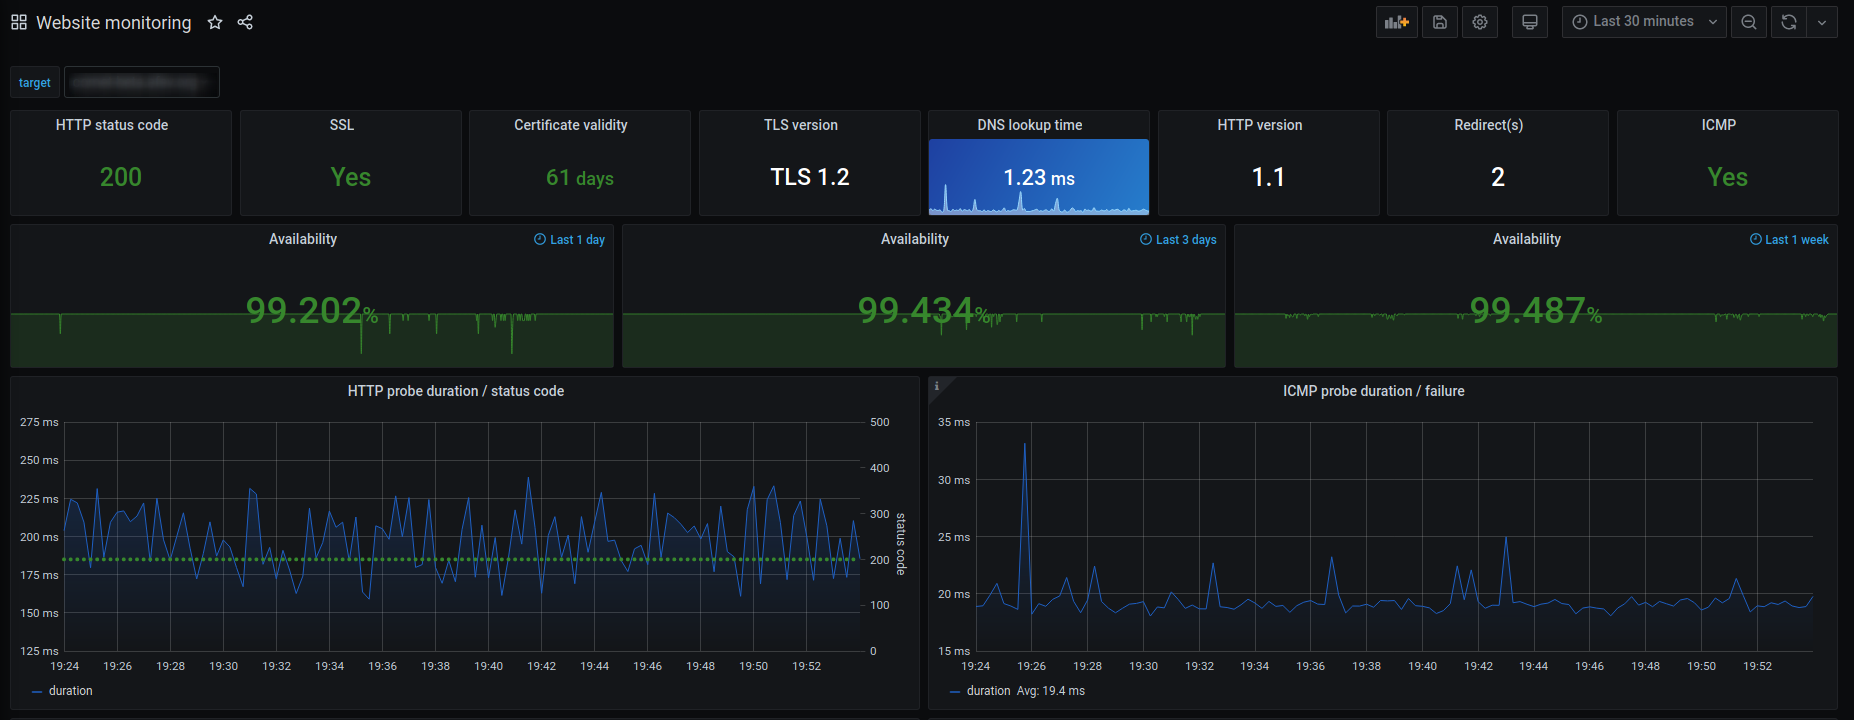
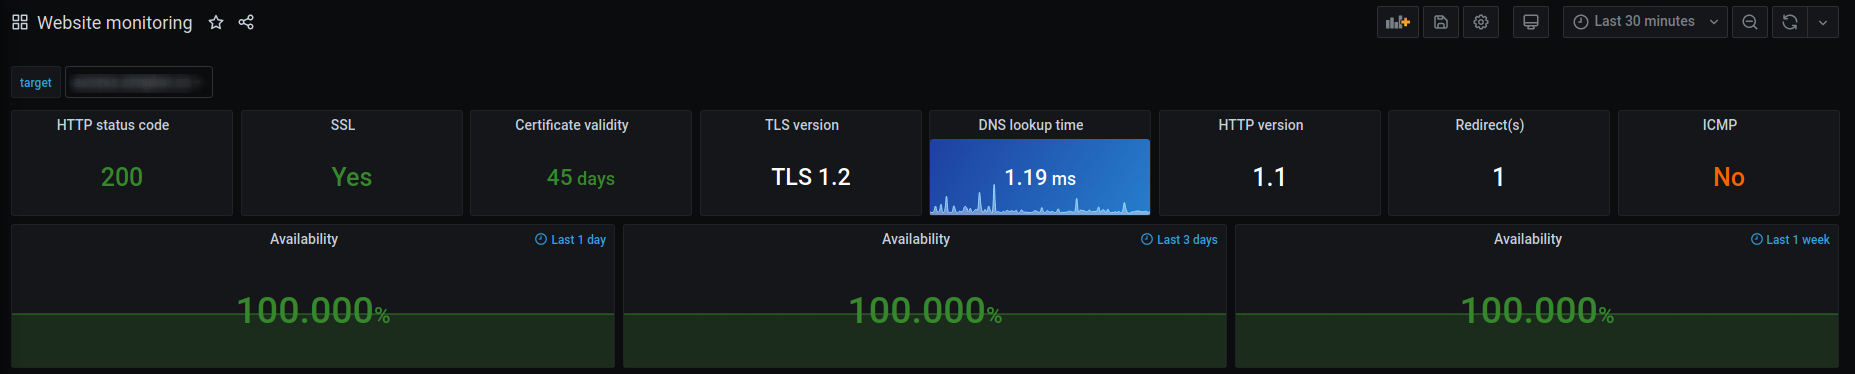
Monitore your websites availability with Prometheus, Prometheus blackbox exporter and Grafana.
- HTTP status code
- HTTP redirects
- HTTP version
- TLS version
- Certificate validity
- ICMP
- DNS lookup time
- Availability over the last 24 hours, 3 days and 7 days
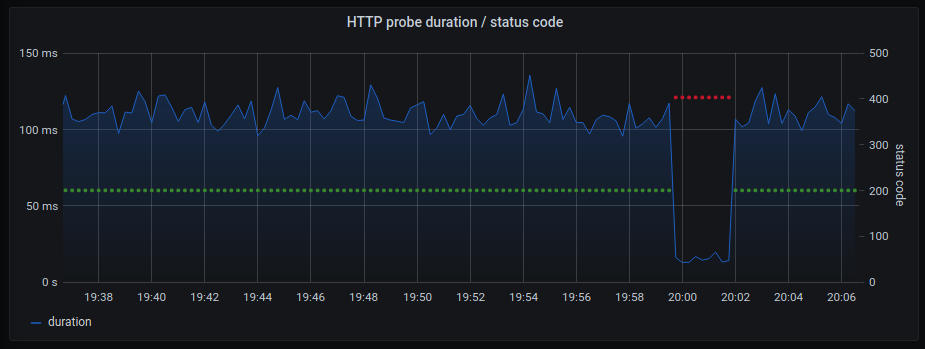
- Probe duration and status code history
Import the dashboard and use your Prometheus datasource and set the right blackbox http and icmp jobs name. Icmp is optional.
If you don't have Prometheus or Prometheus blackbox exporter up and running you can use my docker-compose setup.
Export Dashboard✕
Download
Copy to Clipboard