SpringBoot APM Dashboard 20,36420,364 5.0 (3 reviews)
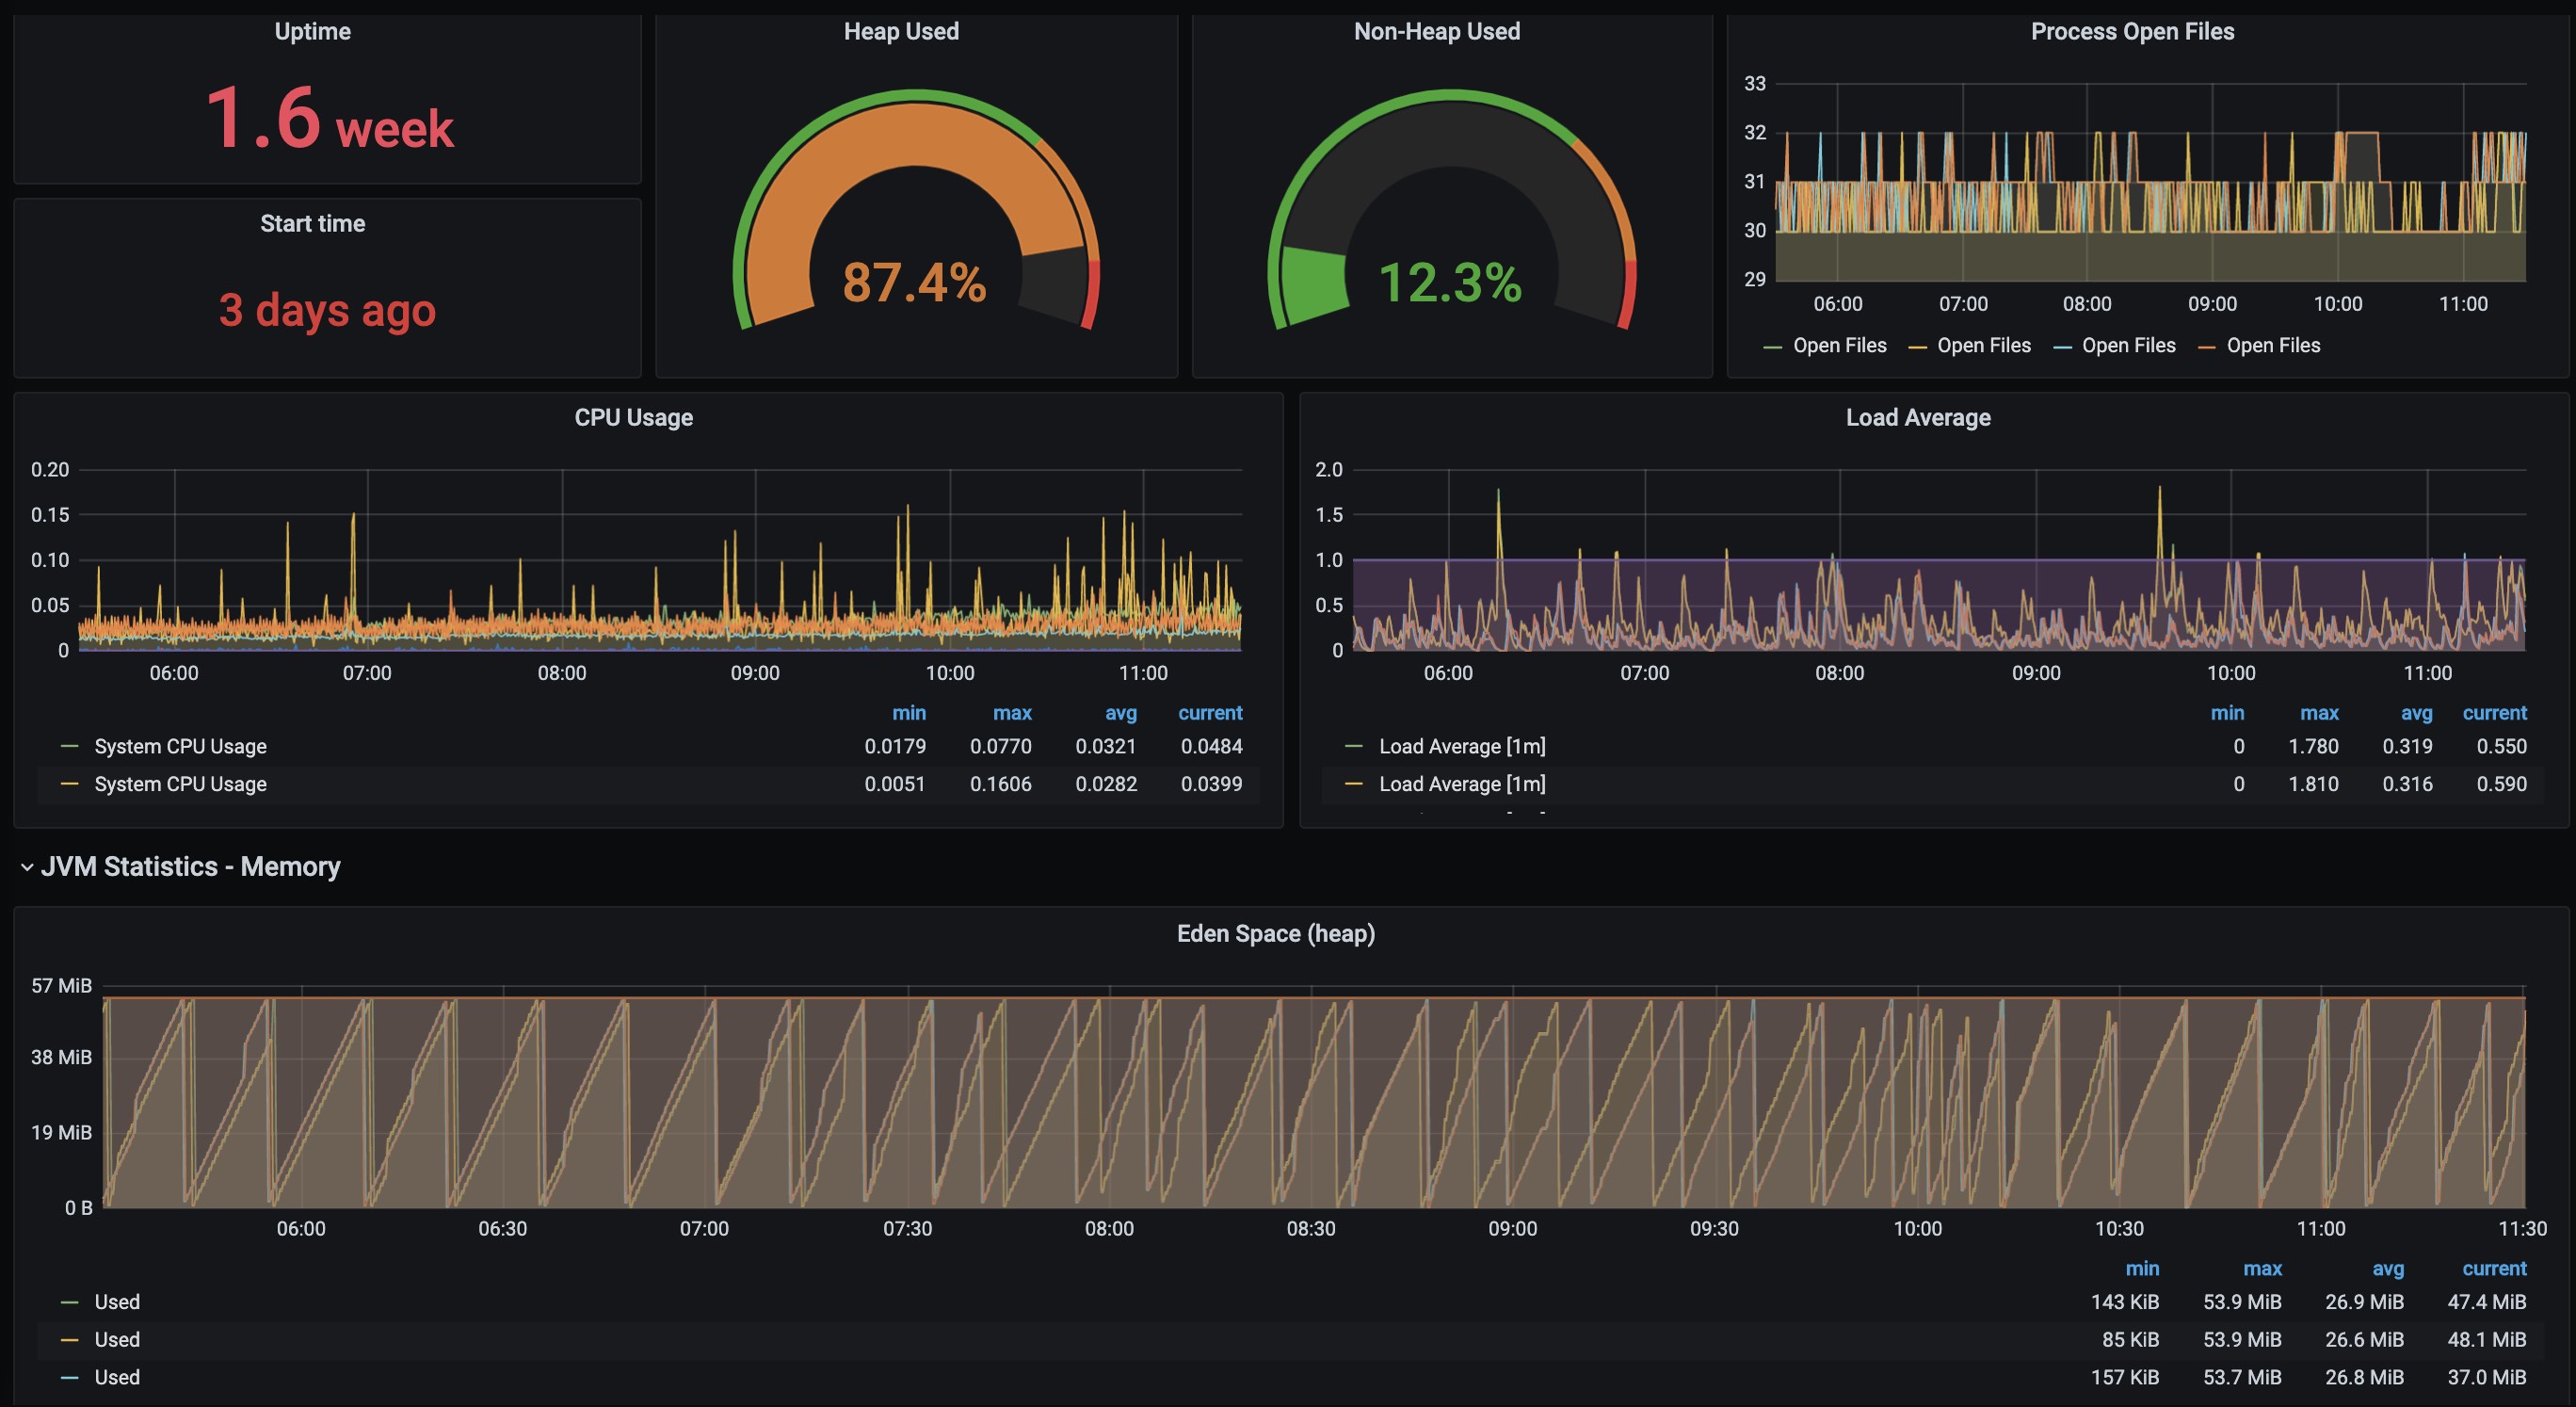
A dashboard for Java Springboot Applications deployed on a Kubernetes Cluster.
The dashboard supports ALL Nodes in the Node selector.
Used Metrics 4343
process_uptime_seconds
jvm_memory_used_bytes
jvm_memory_max_bytes
process_files_open_files
process_files_max
-
process_start_time_seconds
system_cpu_usage
process_cpu_usage
system_load_average_
system_cpu_count
jvm_memory_committed_bytes
jvm_classes_loaded_classes
jvm_classes_unloaded_classes_total
jvm_buffer_memory_used_bytes
jvm_buffer_total_capacity_bytes
jvm_threads_daemon_threads
jvm_threads_live
jvm_threads_peak
jvm_gc_memory_allocated_bytes_total
jvm_gc_memory_promoted_bytes_total
jvm_gc_pause_seconds_count
jvm_gc_pause_seconds_sum
hikaricp_connections
hikaricp_connections_active
hikaricp_connections_idle
hikaricp_connections_pending
hikaricp_connections_timeout_total
hikaricp_connections_creation_seconds_sum
hikaricp_connections_creation_seconds_count
hikaricp_connections_usage_seconds_sum
hikaricp_connections_usage_seconds_count
hikaricp_connections_acquire_seconds_sum
hikaricp_connections_acquire_seconds_count
http_server_requests_seconds_count
http_server_requests_seconds_sum
tomcat_global_error_total
tomcat_sessions_active_current_sessions
tomcat_global_sent_bytes_total
tomcat_global_received_bytes_total
tomcat_threads_config_max
tomcat_threads_current
tomcat_threads_busy
logback_events_total