Node Exporter Full 343,574343,574
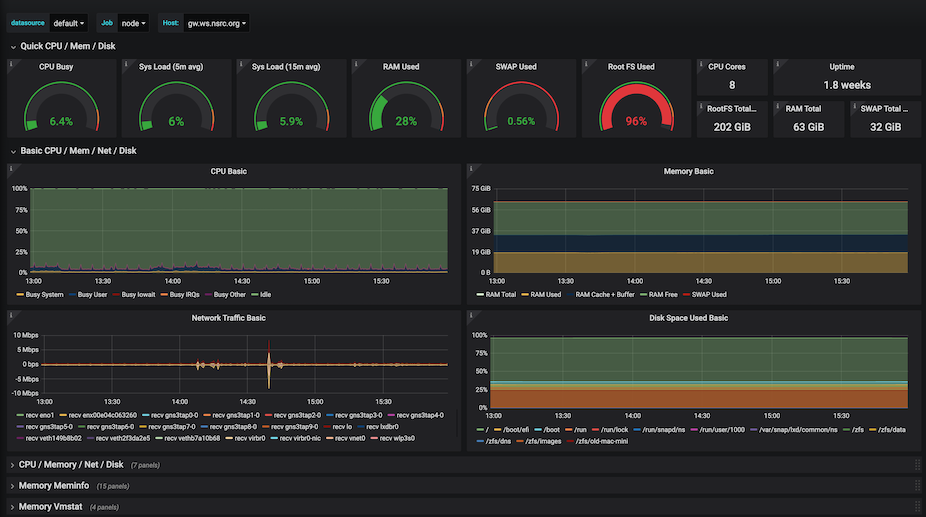
This dashboard is forked from the excellent 1860 node exporter dashboard which gives a lot of detail for CPU, disk and network activity.
This version uses the instance label directly, without requiring any port number it it, to support meaningful instance labels. It also adds a constant $diskdevices to adjust the regular expression to match disk devices.
NOTE: the original dashboard 1860 has now taken these changes on board, so this version is no longer required. See: https://github.com/rfrail3/grafana-dashboards/issues/57
Used Metrics 2626
-
node_cpu_seconds_total
-
node_load5
-
node_load15
-
node_memory_MemTotal_bytes
-
node_memory_MemFree_bytes
-
node_memory_MemAvailable_bytes
-
node_memory_SwapTotal_bytes
-
node_memory_SwapFree_bytes
-
node_filesystem_avail_bytes
-
node_filesystem_size_bytes
-
node_time_seconds
-
node_boot_time_seconds
-
node_disk_reads_completed_total
-
node_disk_writes_completed_total
-
node_disk_read_bytes_total
-
node_disk_written_bytes_total
-
node_disk_read_time_seconds_total
-
node_disk_write_time_seconds_total
-
node_disk_io_time_weighted_seconds_total
-
node_disk_reads_merged_total
-
node_disk_writes_merged_total
-
node_disk_io_time_seconds_total
-
node_disk_discard_time_seconds_total
-
node_disk_io_now
-
node_disk_discards_completed_total
-
node_disk_discards_merged_total