Kubernetes - Cluster Overview 7,0667,066
4/30/2020
4/30/2020
1
>=6.7.3
Prometheus
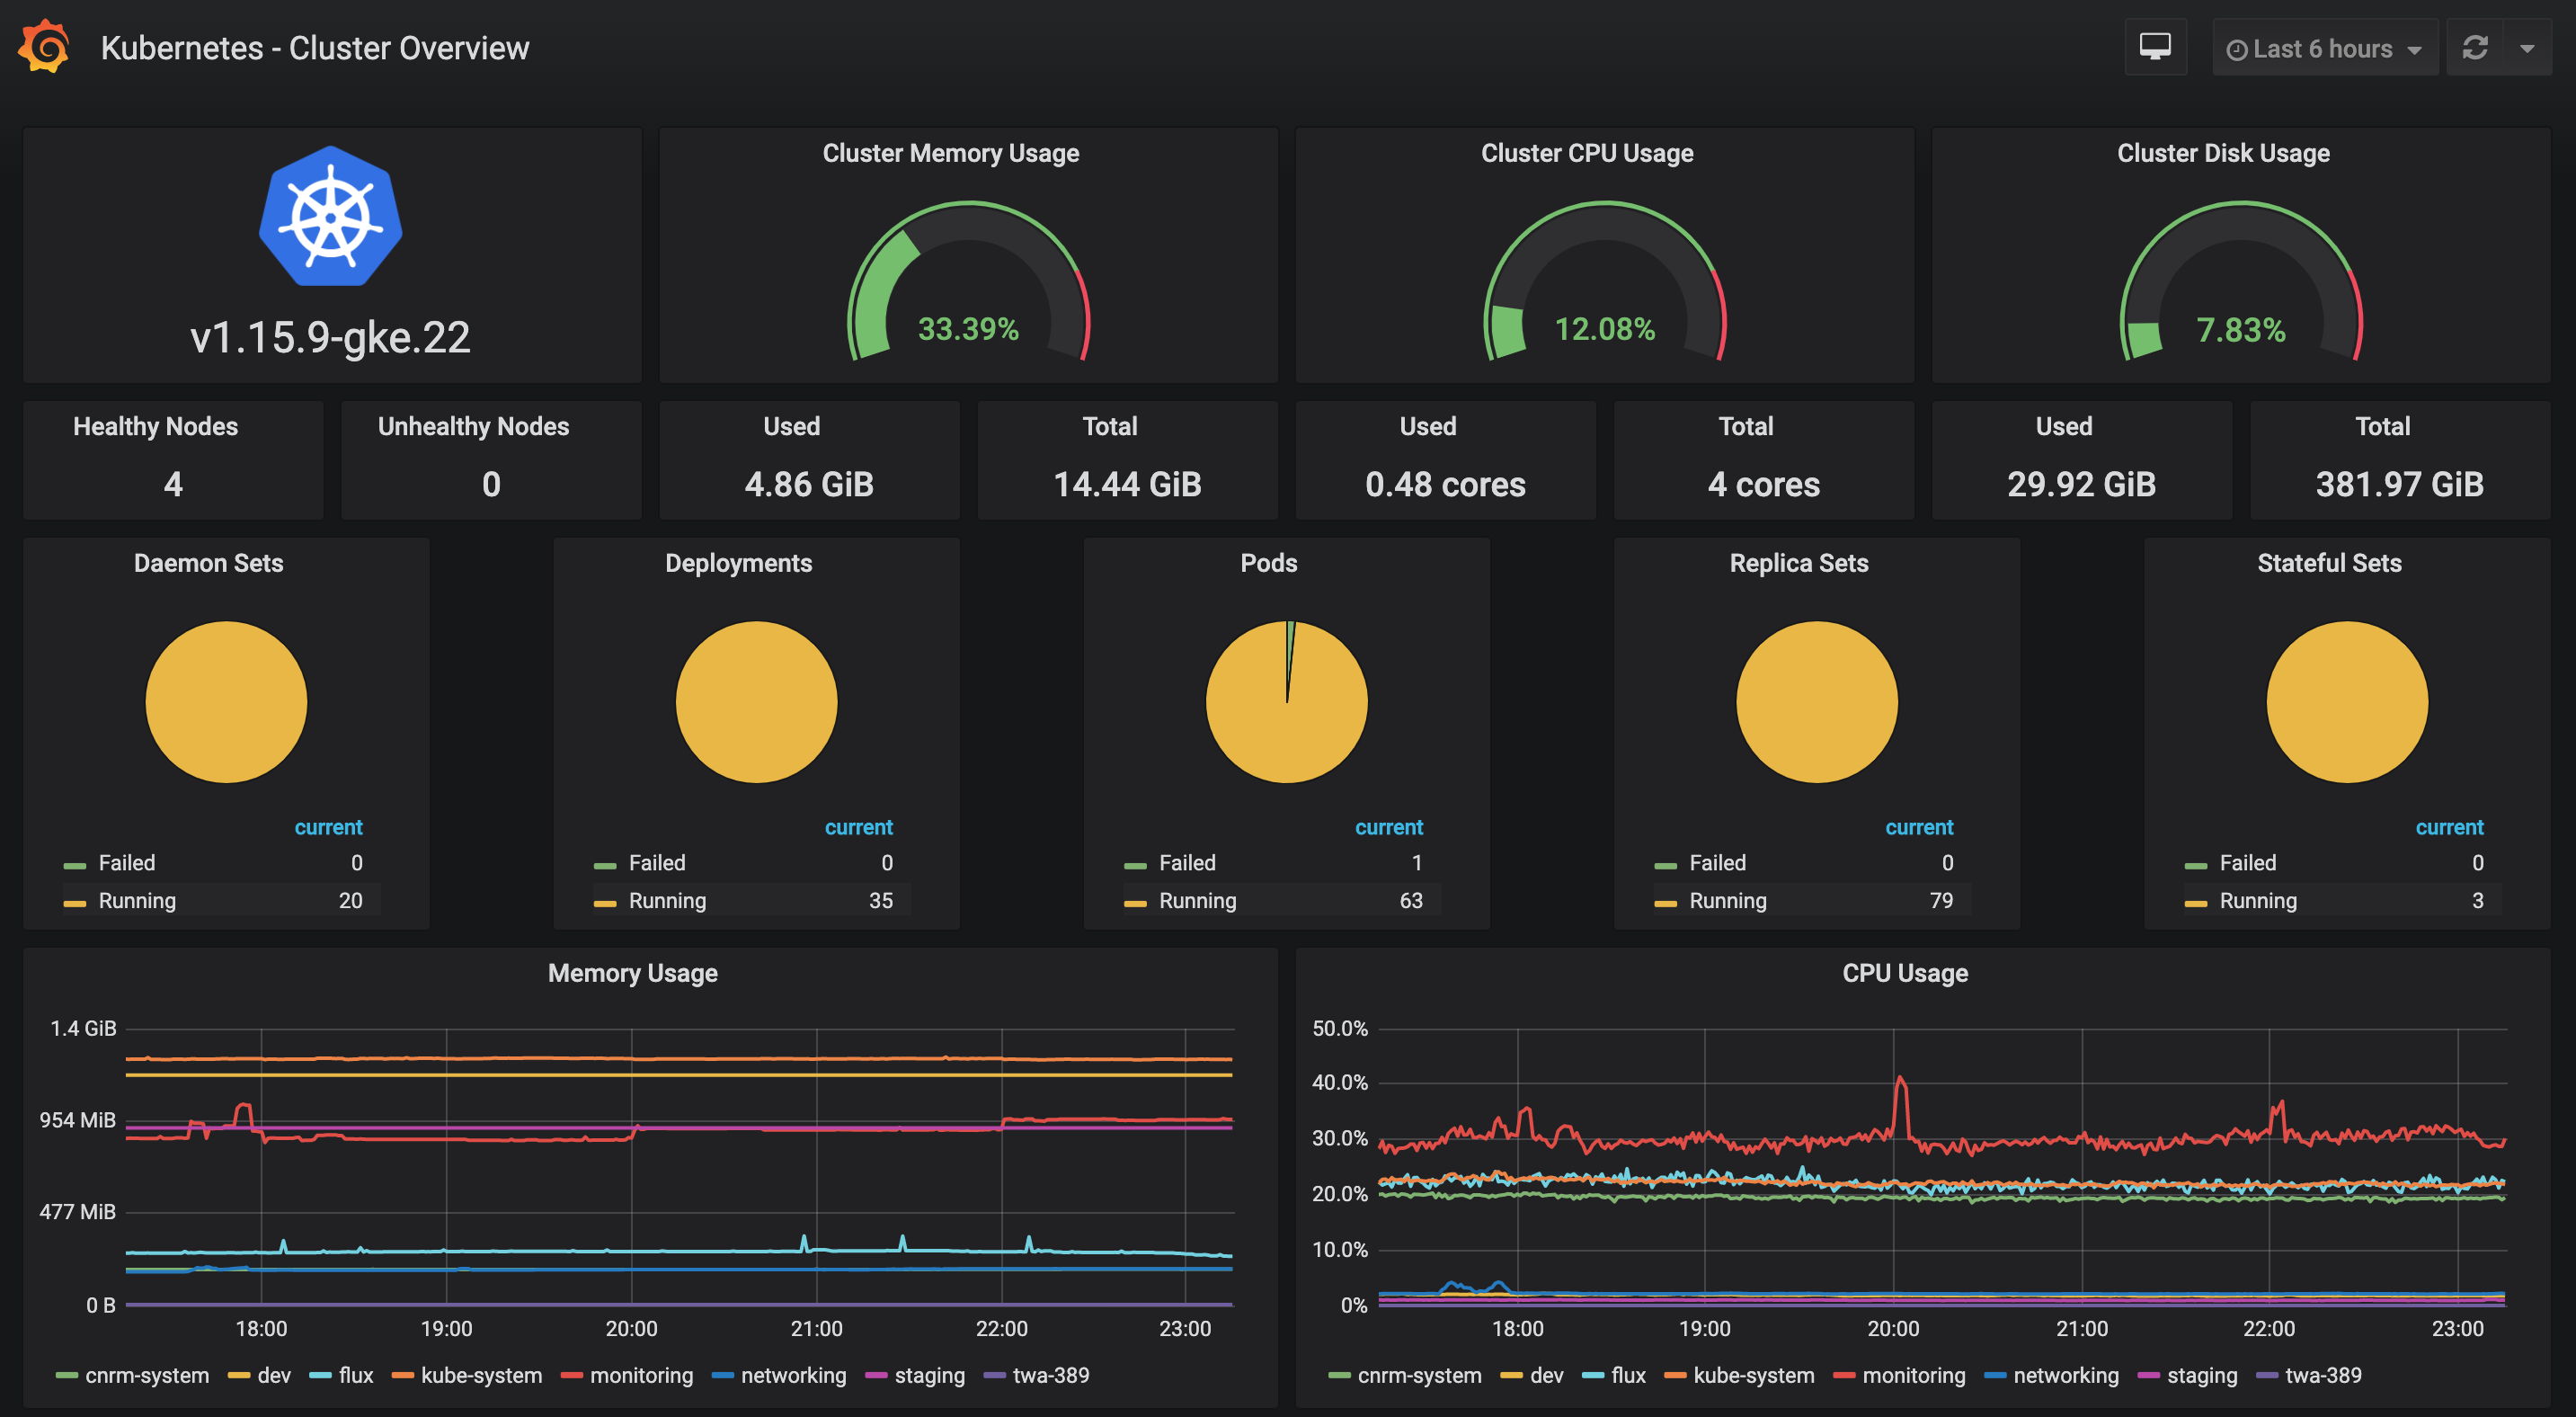
A single-page dashboard with critical cluster-level Kubernetes metrics including CPU usage, memory utilization and disk space remaining. Counts of Kubernetes primitives such as deployments, pods and daemon sets are also monitored.
Export Dashboard✕
Download
Copy to Clipboard
Used Metrics 1616
kube_pod_status_phase
-
container_memory_working_set_bytes
-
machine_memory_bytes
-
container_cpu_usage_seconds_total
-
machine_cpu_cores
-
container_fs_usage_bytes
-
container_fs_limit_bytes
kube_node_spec_unschedulable
kube_daemonset_status_number_unavailable
kube_daemonset_status_number_available
kube_deployment_created
kube_deployment_status_replicas_available
kube_replicaset_created
kube_replicaset_status_ready_replicas
kube_statefulset_created
kube_statefulset_status_replicas_ready