Mikrotik Dashboard - Prometheus 1,6111,611 2.0 (1 reviews)
4/8/2020
4/8/2020
1
>=6.2.2
Prometheus
Export Dashboard✕
Download
Copy to Clipboard
Used Metrics 1717
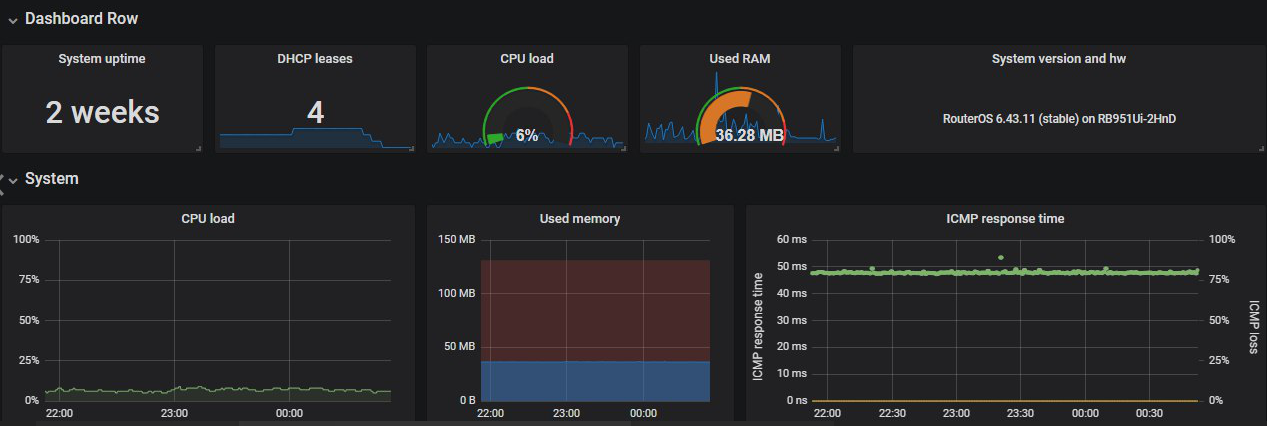
sysName
mikrotik_system_uptime
mikrotik_dhcp_leases_active_count
mikrotik_system_cpu_load
mikrotik_system_total_memory
mikrotik_system_free_memory
mikrotik_system_total_hdd_space
mikrotik_system_free_hdd_space
-
probe_icmp_duration_seconds
-
probe_success
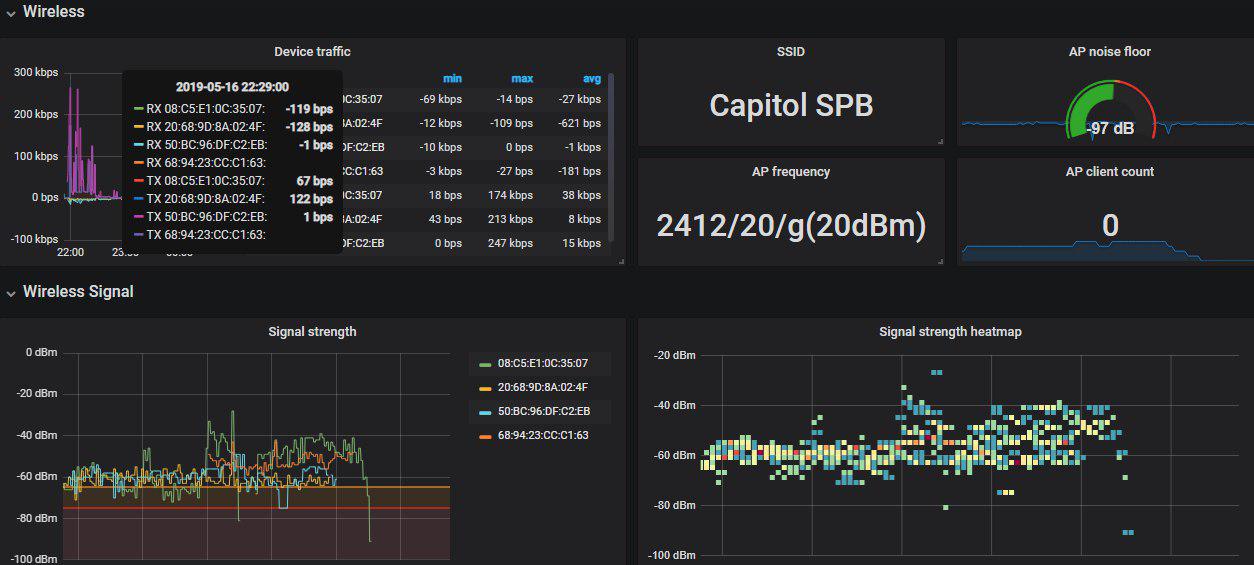
mikrotik_interface_rx_byte
mikrotik_interface_tx_byte
mikrotik_dhcp_leases_metrics
mikrotik_interface_rx_error
mikrotik_interface_tx_error
mikrotik_monitor_status
mikrotik_monitor_rate