Traefik 2 65,21465,214 5.0 (2 reviews)
12/23/2019
12/23/2019
1
Docker
>=6.4.3
Prometheus
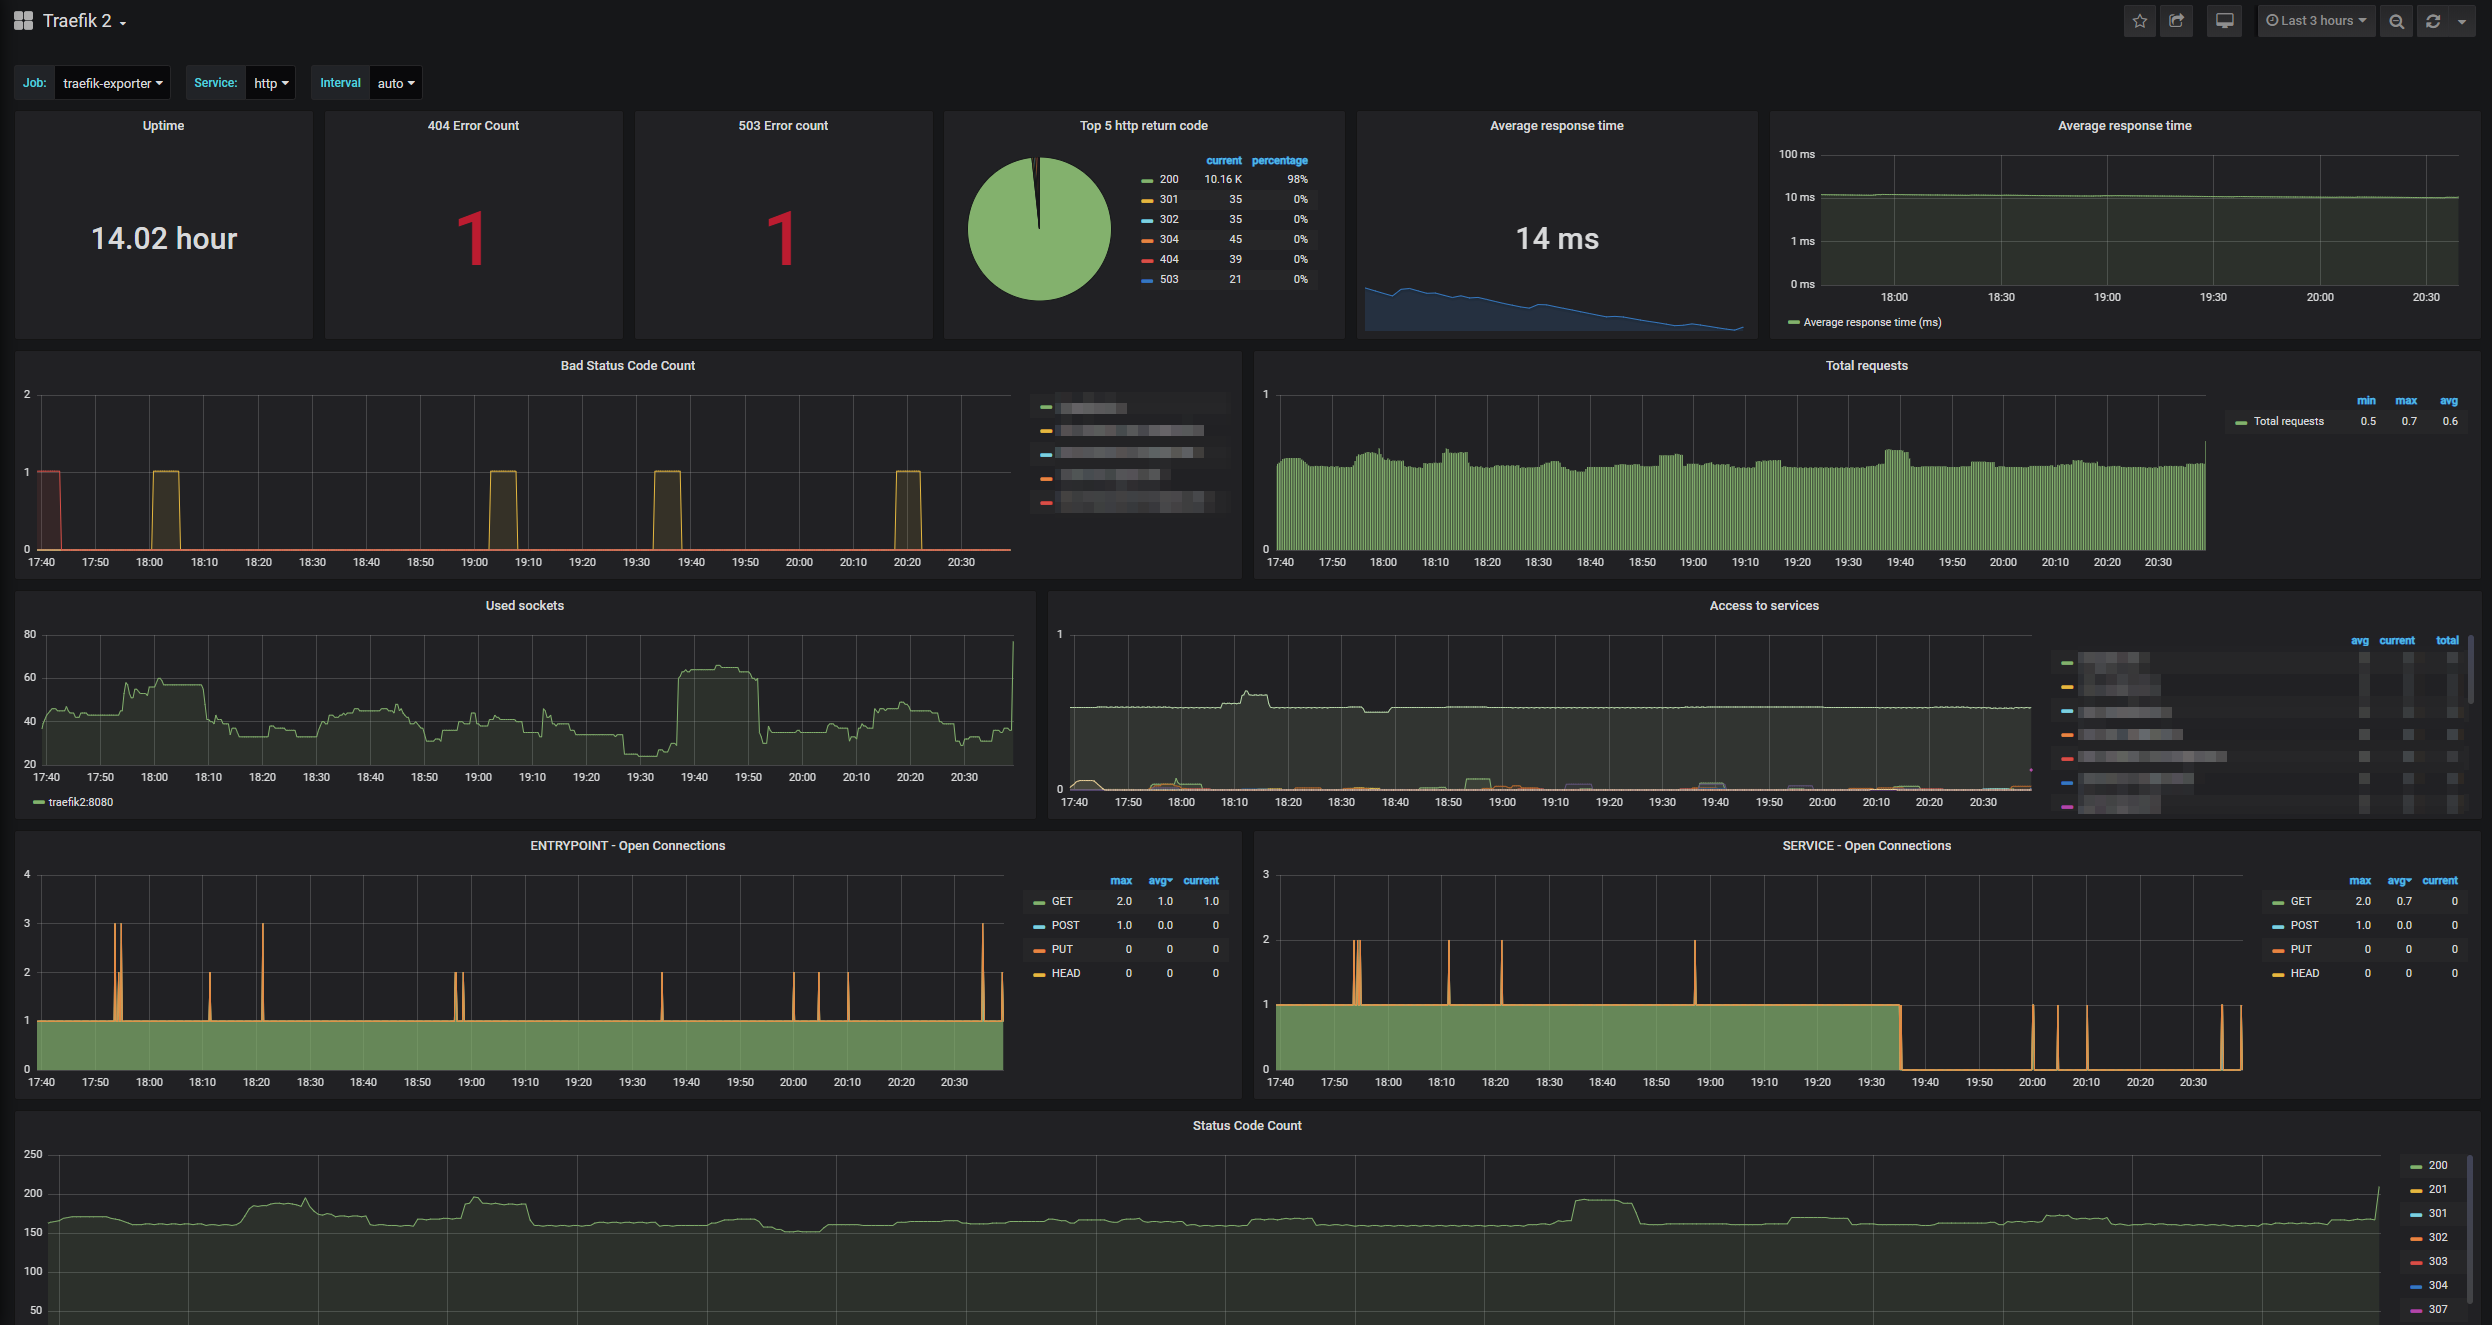
Simple dashboard for Traefik 2, visualizing every important metric for your Traefik instance(s).
It provides you with statistics to your internals of Traefik, HTTP statics and gives you a brief overview on the health of your traefik instance(s).
Originally this dashobard has been created by ichasco, that can also be found on grafana.com.
Export Dashboard✕
Download
Copy to Clipboard
Used Metrics 1010
-
process_start_time_seconds
traefik_service_requests_total
interval
topk
traefik_entrypoint_request_duration_seconds_sum
traefik_entrypoint_requests_total
traefik_service_request_duration_seconds_sum
-
process_open_fds
traefik_entrypoint_open_connections
traefik_service_open_connections