Kubernetes Cluster Dashboard 15,67115,671
12/5/2019
12/5/2019
1
Docker
>=6.4.2
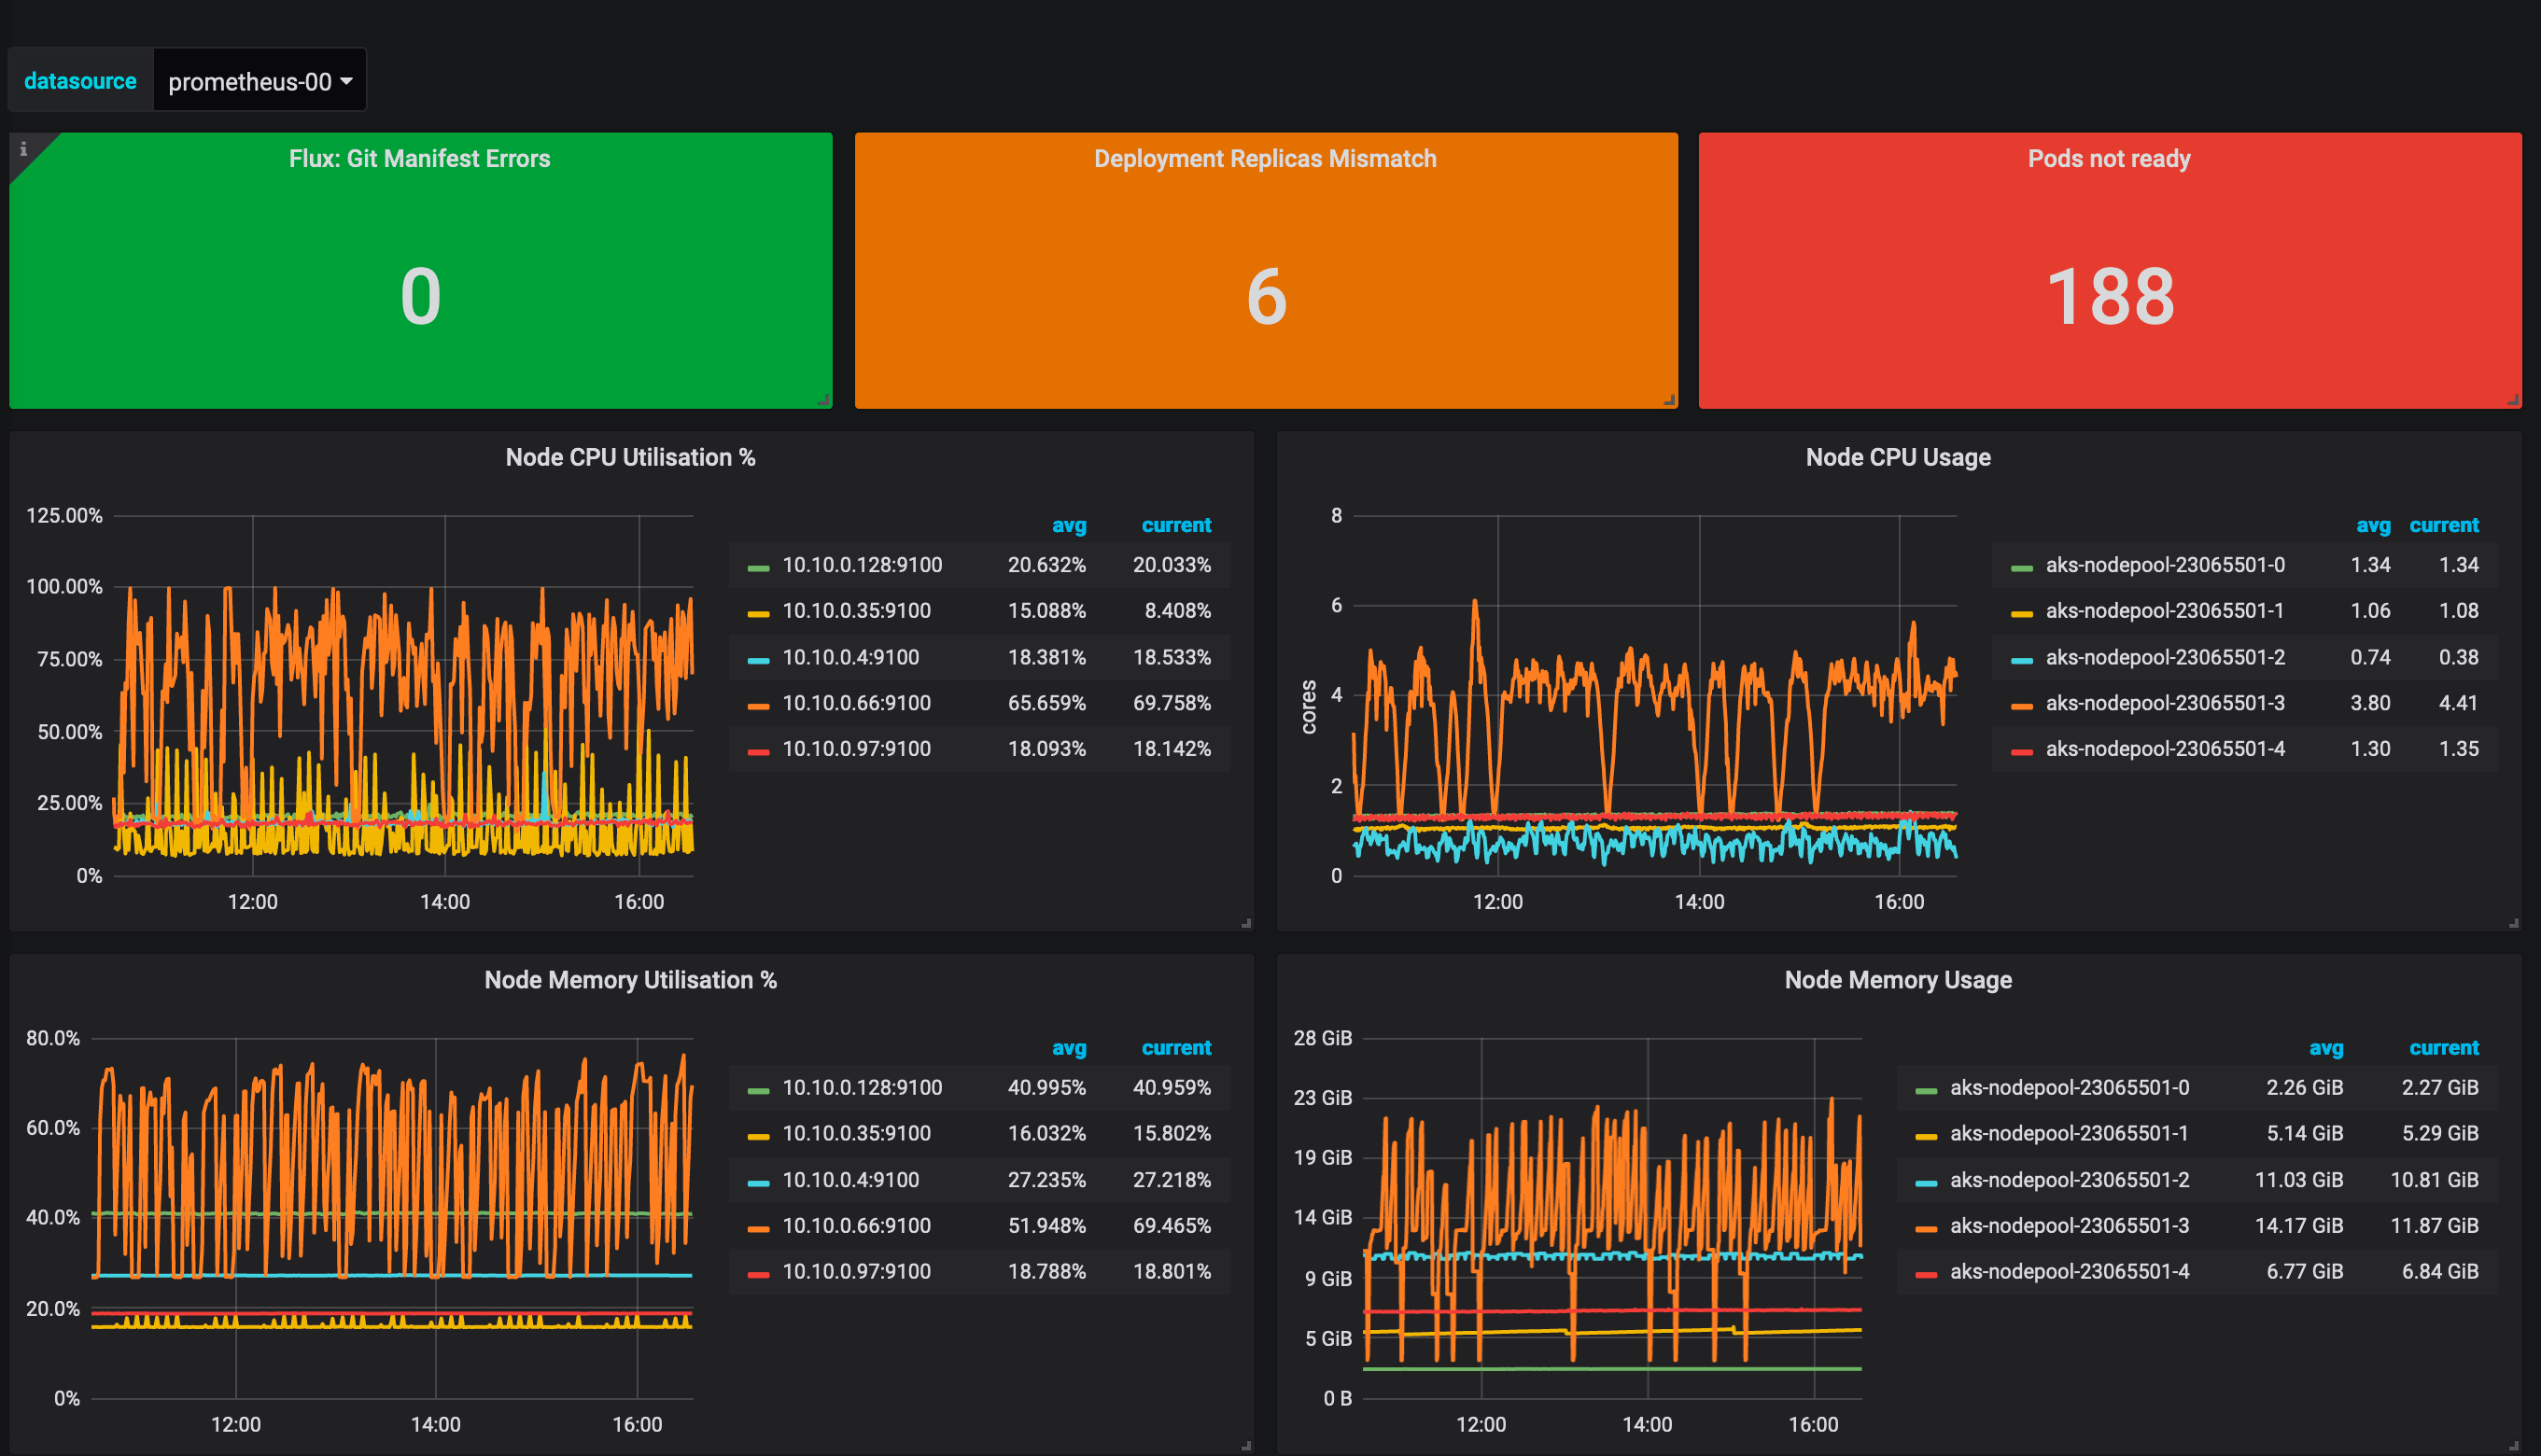
This dashboard collects data from the Prometheus Datasource. It has been tested with an installation of the Prometheus Operator project. It also requires Flux to be used by the cluster in a GitOps deployment model and the respective prometheus metrics to be scrapped.
Export Dashboard✕
Download
Copy to Clipboard
Used Metrics 99
flux_daemon_sync_manifests
kube_deployment_status_replicas_unavailable
kube_pod_status_phase
instance:node_cpu_utilisation:rate
-
container_cpu_usage_seconds_total
instance:node_memory_utilisation:ratio
-
container_memory_usage_bytes
kube_pod_container_resource_requests_cpu_cores
kube_pod_container_resource_requests_memory_bytes