prometheus-net 8,4548,454
6/24/2019
10/14/2019
4
Web Servers
>=6.3.6
Prometheus
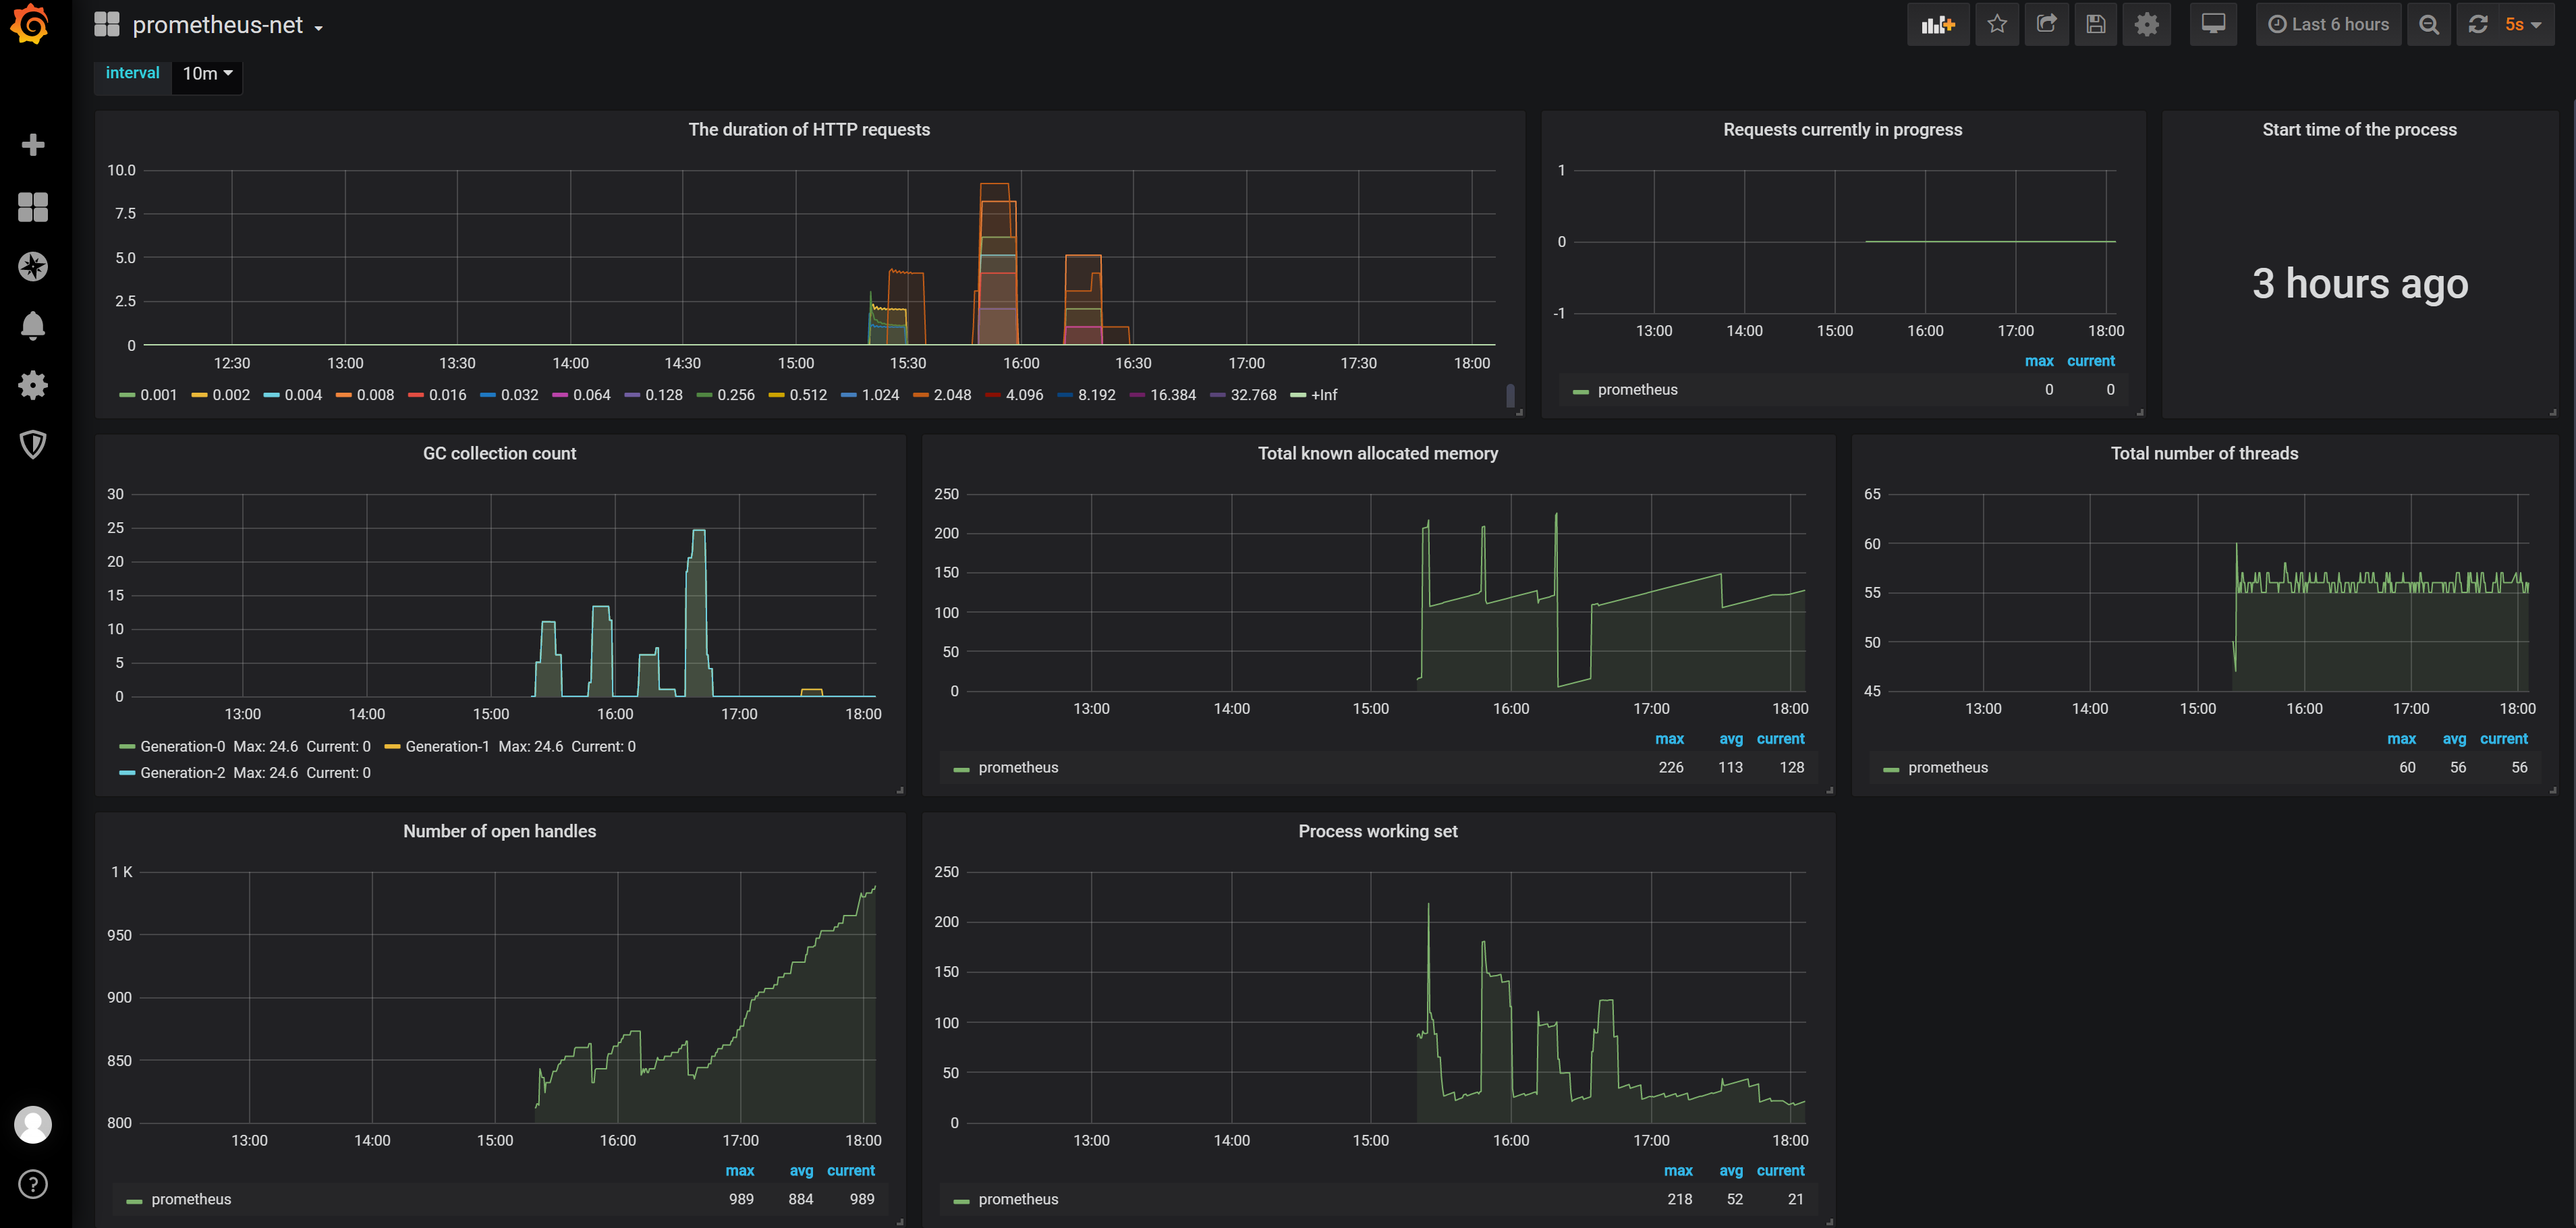
This is a pre-built Grafana dashboard for default metrics exposed by prometheus-net/Prometheus.AspNetCore
Welcome any suggestion and feedback here or in Github repository: https://github.com/AChehre/prometheus-net-dashboard
Export Dashboard✕
Download
Copy to Clipboard
Used Metrics 99
http_request_duration_seconds_bucket
interval
http_requests_in_progress
-
process_start_time_seconds
dotnet_collection_count_total
dotnet_total_memory_bytes
process_num_threads
process_open_handles
process_working_set_bytes