Neo4j Dashboard 3,5013,501 5.0 (1 reviews)
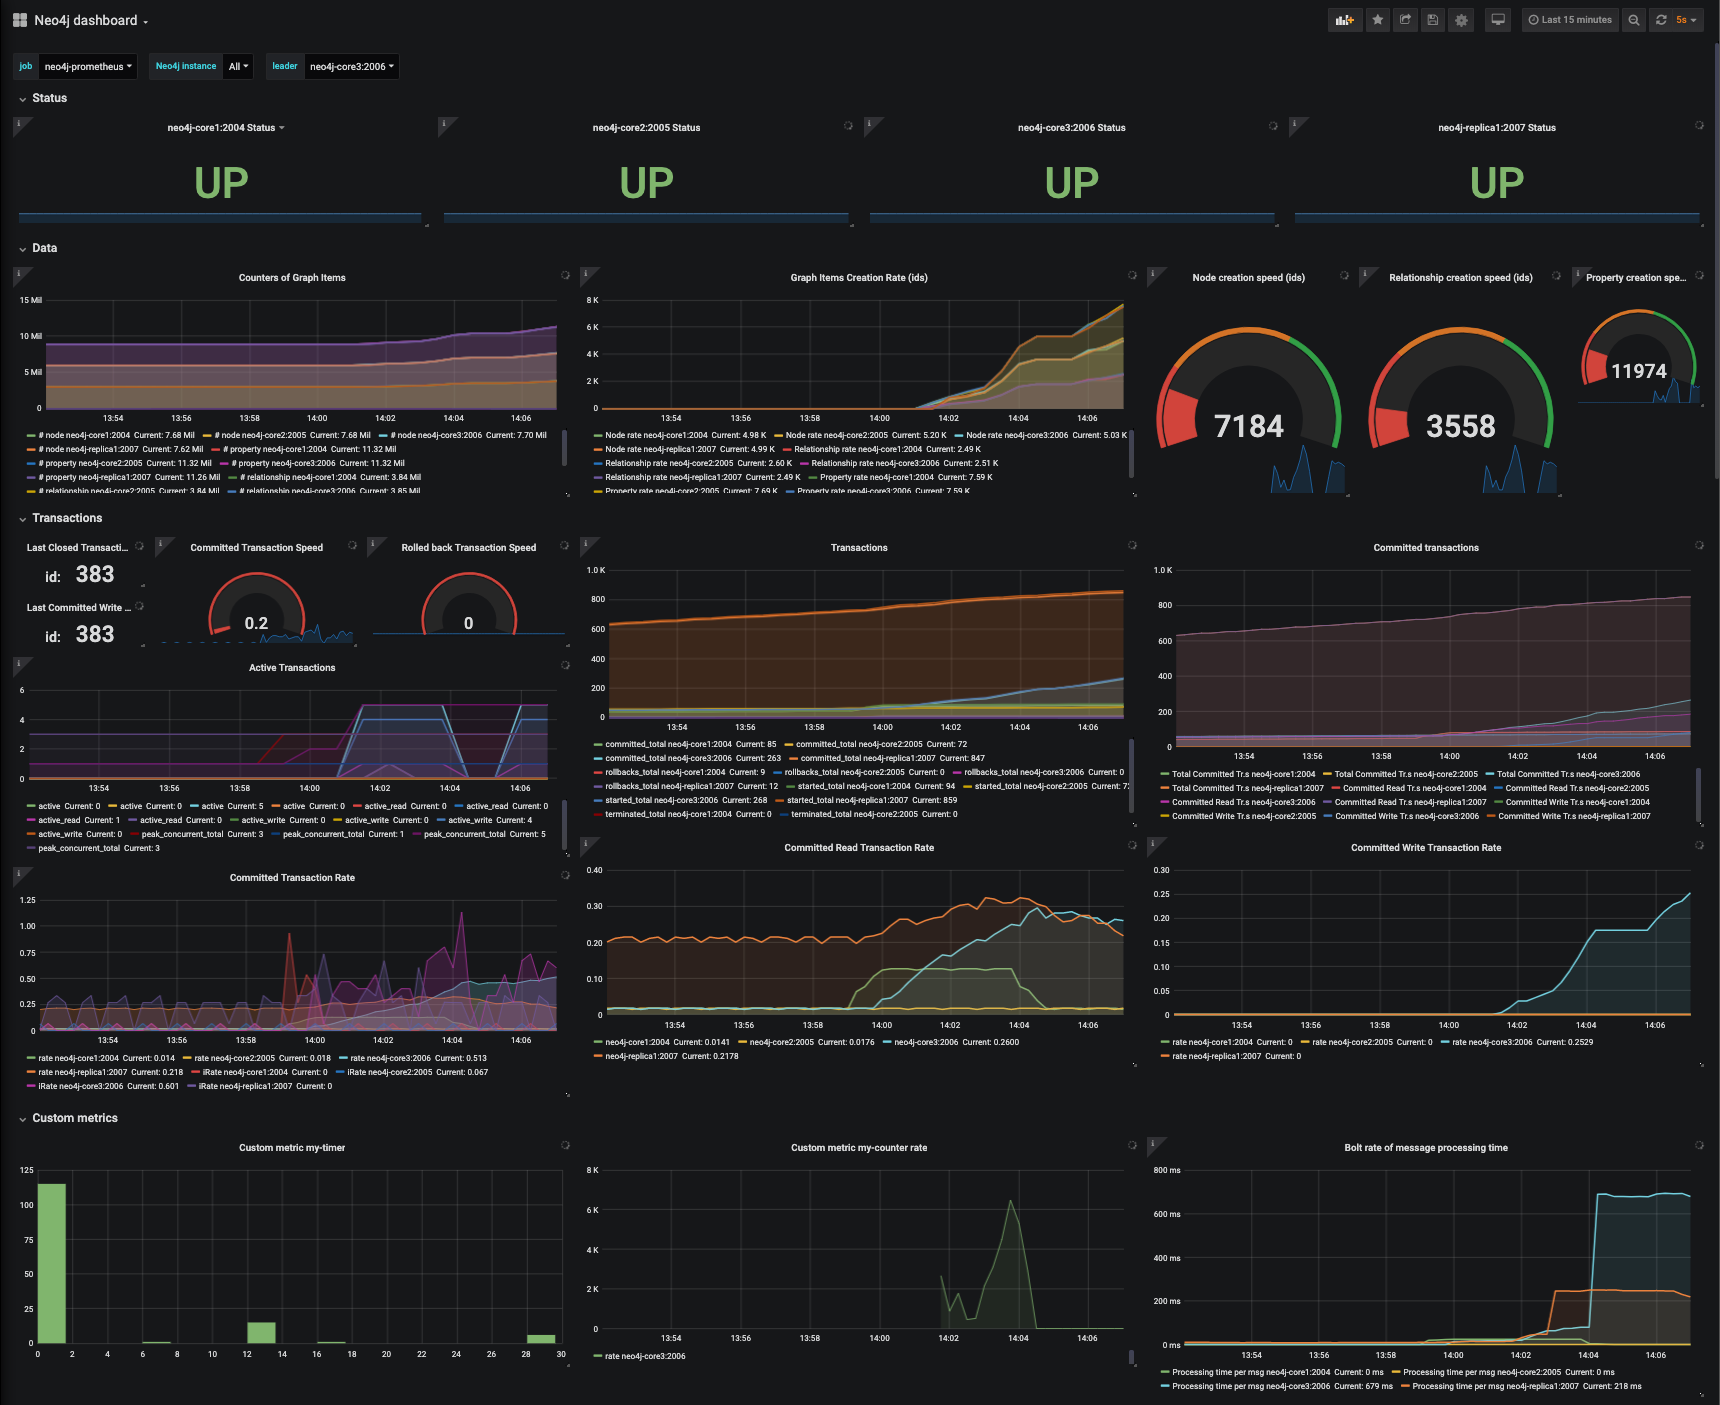
This is an example dashboard for monitoring a Neo4j causal cluster with Prometheus and Grafana.
For a full tutorial please read Monitoring Neo4j and Procedures with Prometheus and Grafana on GraphAware blog.
In that short series we cover
- how to expose Neo4j metrics to Prometheus
- how to create custom metrics in your Neo4j Procedure (with example code)
- how to create a complete Neo4j dashboard with Grafana (with many Neo4j specific examples, also for causal cluster setup)
- how to quickstart Neo4j monitoring with a docker-compose project
Used Metrics 5050
-
up
label
neo4j_ids_in_use_
neo4j_ids_in_use_relationship_type
neo4j_ids_in_use_node
interval
neo4j_ids_in_use_relationship
neo4j_ids_in_use_property
neo4j_transaction_last_closed_tx_id_total
neo4j_transaction_committed_total
neo4j_transaction_rollbacks_total
neo4j_transaction_
neo4j_transaction_committed_read_total
neo4j_transaction_committed_write_total
neo4j_transaction_last_committed_tx_id_total
neo4j_transaction_active_read
neo4j_transaction_active_write
neo4j_transaction_peak_concurrent_total
com_graphaware_neo4j_monitoring_MonitorProcedure_my_timer
com_graphaware_neo4j_monitoring_MonitorProcedure_my_counter
neo4j_bolt_messages_
neo4j_bolt_messages_received_total
neo4j_bolt_messages_started_total
neo4j_bolt_accumulated_queue_time_total
neo4j_bolt_connections_
neo4j_bolt_sessions_
neo4j_bolt_accumulated_processing_time_total
neo4j_page_cache_page_faults_total
neo4j_page_cache_pins_total
neo4j_page_cache_unpins_total
neo4j_page_cache_evictions_total
neo4j_page_cache_eviction_exceptions_total
neo4j_page_cache_flushes_total
neo4j_page_cache_hits_total
neo4j_page_cache_hit_ratio
neo4j_
neo4j_check_point_check_point_duration
vm_gc_time_g1_old_generation_total
vm_gc_time_g1_young_generation_total
vm_gc_count_g1_old_generation_total
vm_gc_count_g1_young_generation_total
vm_thread_count
vm_memory_buffer_direct_used
vm_memory_buffer_mapped_used
neo4j_causal_clustering_read_replica_pull_updates_total
neo4j_causal_clustering_core_message_processing_timer
neo4j_causal_clustering_core_message_processing_timer_election_timeout
neo4j_causal_clustering_core_message_processing_timer_election_timeout_count
neo4j_cypher_replan_events_total
neo4j_cypher_replan_wait_time_total