Grafana-Prometheus-Node_Exporter_Host_Metrics_Dashboard 1,6901,690
6/2/2019
6/2/2019
1
Host Metrics
>=6.2.1
Prometheus
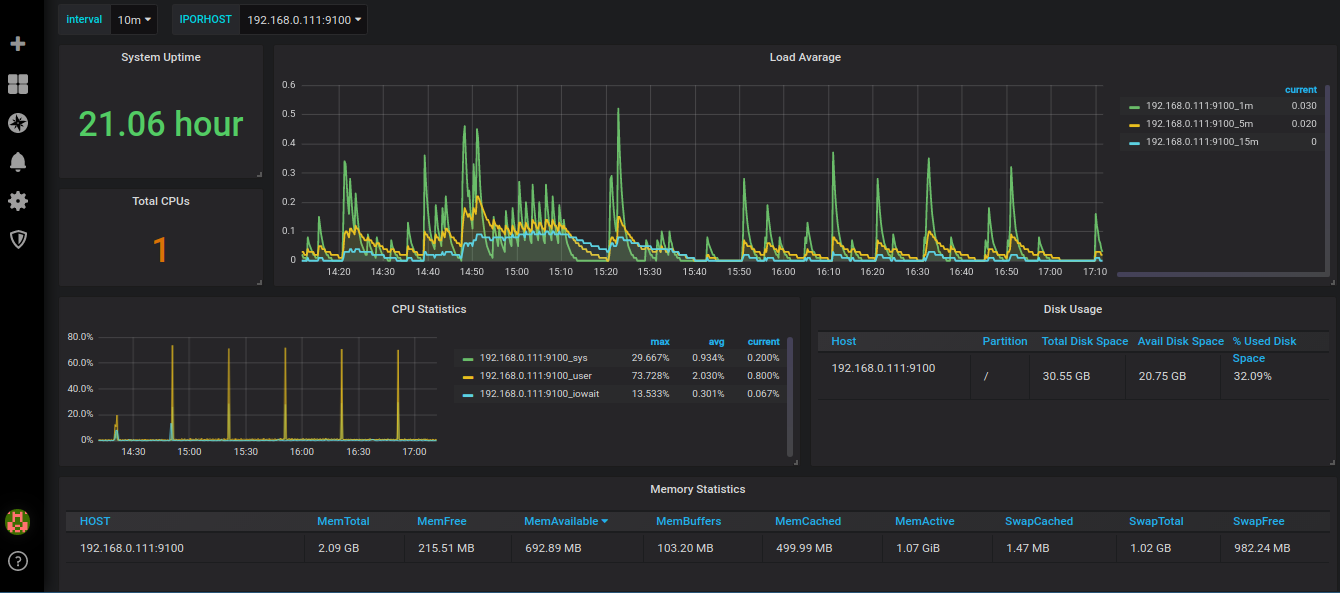
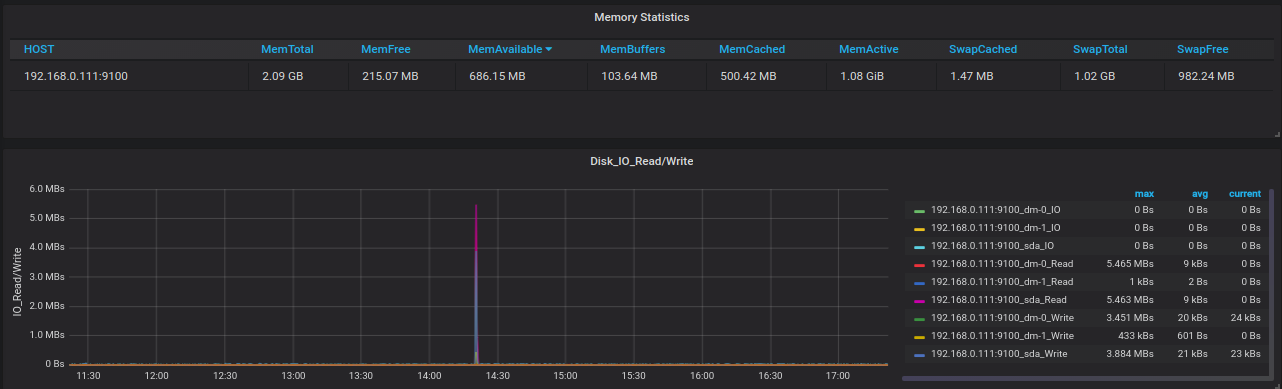
This is a simple Grafana Dashboard to display Host Metrics such CPU, Memory, DISK IO, Load Average, collected using the Prometheus Node Exporter
Export Dashboard✕
Download
Copy to Clipboard
Used Metrics 2020
-
node_boot_time_seconds
-
node_load1
-
node_load5
-
node_load15
-
node_cpu_seconds_total
-
node_filesystem_size_bytes
-
node_filesystem_avail_bytes
-
node_memory_MemTotal_bytes
interval
-
node_memory_MemFree_bytes
-
node_memory_MemAvailable_bytes
-
node_memory_Buffers_bytes
-
node_memory_Cached_bytes
-
node_memory_Active_bytes
-
node_memory_SwapCached_bytes
-
node_memory_SwapTotal_bytes
-
node_memory_SwapFree_bytes
-
node_disk_io_time_seconds_total
-
node_disk_read_bytes_total
-
node_disk_written_bytes_total