Arista General Statistics by IP 976976 5.0 (1 reviews)
5/18/2019
5/18/2019
1
Host Metrics
>=5.3.0
Prometheus
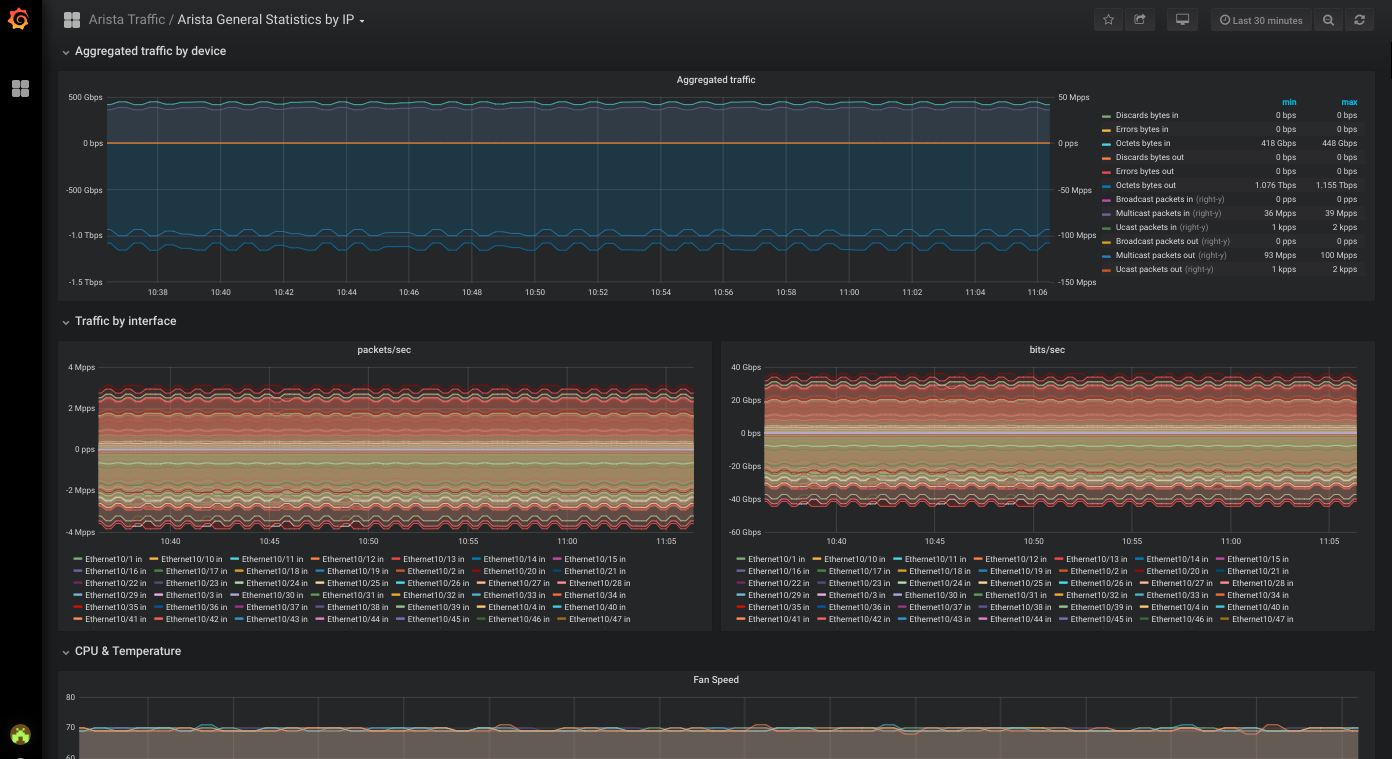
The dashboard shows the following metrics:
- Interface throughput in bits/sec
- Interface bandwidth in percentage
- Packet statistics for Errors and Discard
- Statistics about the transmitted packet types for Unicast, Multicast and Broadcast
Report source available in our Grafana Dashboard GitHub Repository.
Made by Be Smart Be Open in collaboration with Vista Technology.
See also https://github.com/besmartbeopen/dashboard-grafana-prometheus-arista
Export Dashboard✕
Download
Copy to Clipboard
Used Metrics 77
intfCounter
intfPktCounter
fanSpeed
-
process_cpu_seconds_total
tempSensor
powerSensor
voltageSensor